waecE-LEARNING
Home
Technical
Mathematics
Languages
Science
Social Science
Art
Literature Arabic Islamic Studies C.R.KHistory MusicVisual Art Clothing/Textile Home Management Shorthand
 
Agricultural Science Paper 3, Nov/Dec 2009  
Questions: 1 2 3 4   Main
General Comments
Weakness/Remedies
Strength


Question 3

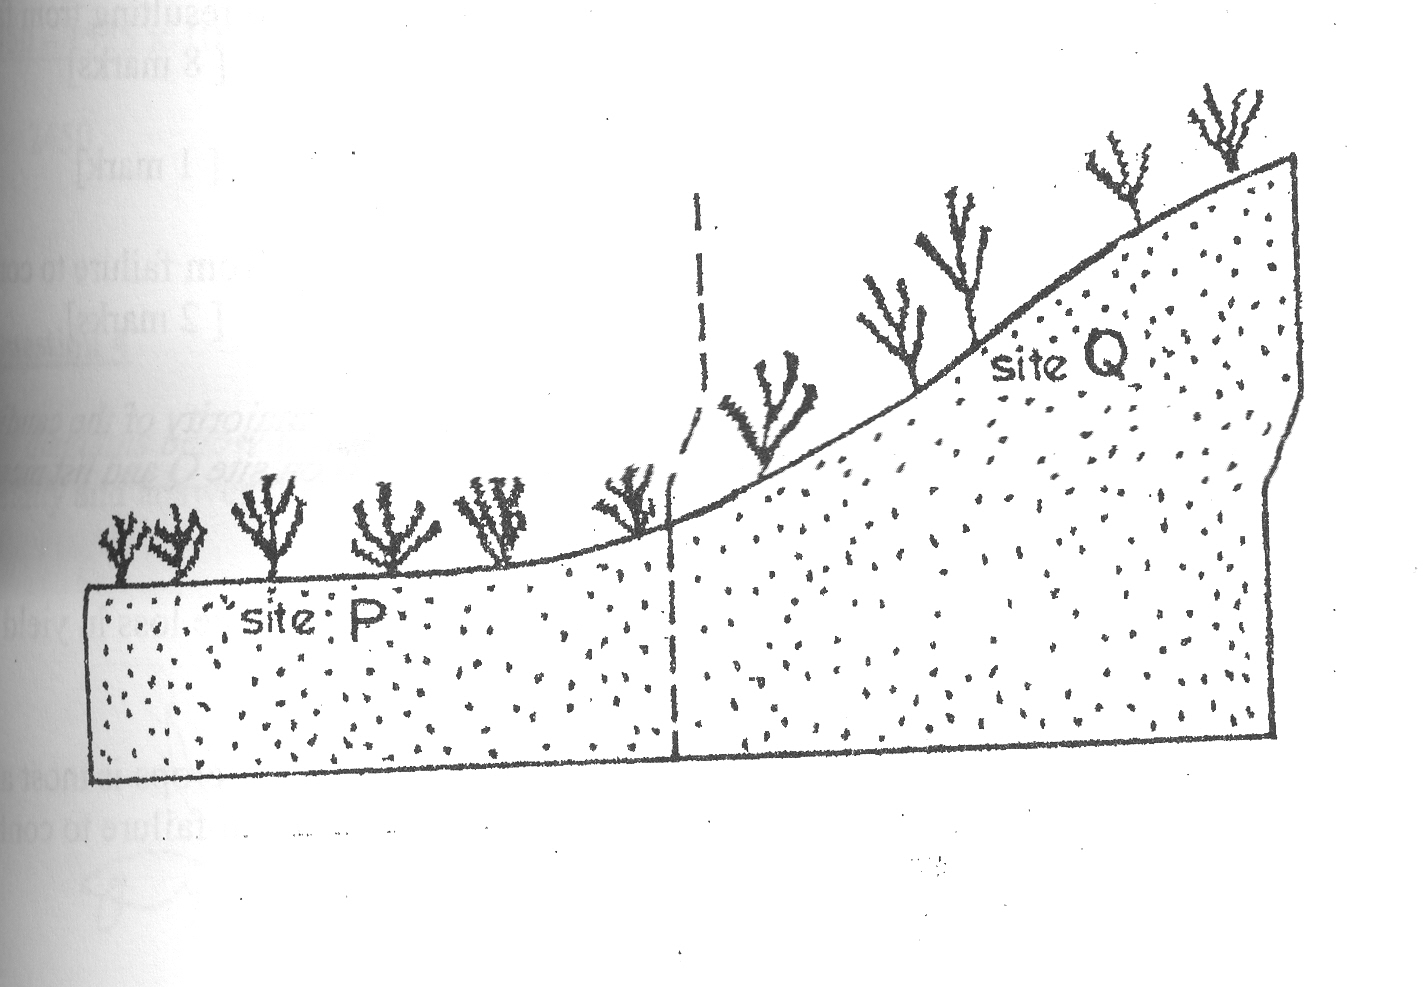
  1.   A farmer cultivated sorghum at two different sites labelled P and Q as shown in the diagram  

below.  The areas covered by the sites were the same.  The farmer observed that yields from site Q were relatively lower than yields from site P.

                Study the illustration and use it to answer the questions that follow


             (i)    Suggest two possible causes of the poor yields observed on site Q.         [2 marks]
            (ii)    List two measures the farmer could adopt to improve yields on site Q.   [2 marks]


  1.    A study was conducted to investigate the effects of weeds on the yields of crops. 

   Results of the study are presented in the table below.

   Use the table to answer the questions that follow.


Crop

    Yield(kg/ha)

Weeded

Not weeded

Millet

3912

2512

Cassava

7225

3852

Soya bean

3148

1155

Onion

2450

1525

  1. For each of the crops, determine the percentage loss in yield resulting from failure to   control weeds.                                                                           [ 8 marks]
  2. Which of the crops is most affected by weeds?                        [ 1 mark]
  3. Suggest two possible reasons for the loss in yield resulting from failure to control weeds.         [ 2 marks]
_____________________________________________________________________________________________________
OBSERVATION

 This question was popular with the candidates.  In 3(a) ( i and ii), majority of the candidates were able to suggest possible causes of the poor yields observed on site Q and list measures the farmer could adopt to improve yields on site Q.
However, in 3b(i), many candidates could not determine the percentage loss in yield resulting from failure to control  weeds.
In 3 (b)(ii and iii), majority of the candidates could state which of the crops is most affected by weeds and suggest possible reasons for the loss in yield resulting from failure to control weeds.
The expected answers include:
Percentage loss in yields for each crops resulting from failure to control weeds
Yield from weeded plot – yield from plot not weeded  X 100
Yield from plot weeded

Millet
3912 – 2512 x 100
      3912                  =     35.79%
Cassava
7225 – 3852  x 100
      7225                  =     46. 69%


Soyabean
3148 – 1155 x 100
         3148                  =     63.31%

Onion
2450 – 1525 x 100

       2450                      =    37.76%
Powered by Sidmach Technologies(Nigeria) Limited .
Copyright © 2012 The West African Examinations Council. All rights reserved.