The table gives the distribution of heights in metres of 100 students
Height |
1.40 -1.42 |
1.43-1.45 |
1.46-1.48 |
1.49-1.51 |
1.52-1.54 |
1.55-1.57 |
1.58-1.60 |
1.61-1.63 |
Frequency |
2 |
4 |
19 |
30 |
24 |
14 |
6 |
1 |
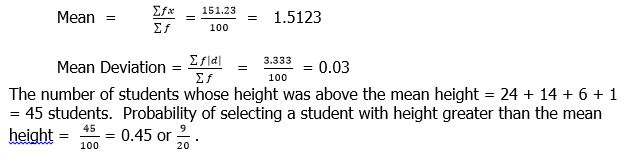
(a) Calculate the:
(i) mean height;
(ii) mean deviation of the distribution.
(b) What is the probability that the height of a student selected at random is greater than the mean height of the distribution?