|
Question 10
|
| Class interval |
Frequency |
60 – 64
65 – 69
70 – 74
75 – 79
80 – 84
85 – 89
90 – 94
95 - 99 |
2
3
6
11
8
7
2
1 |
The table shows the distribution of marks scored by students in an examination.
Calculate, correct to 2 decimal places, the
(a) mean;
(b) standard deviation
of the distribution.
|
| _____________________________________________________________________________________________________ |
|
The Chief Examiner reported that this question was attempted by majority of the
candidates and they performed very well in it. Candidates were reported to have drawn
the appropriate table and applied the appropriate formulae to obtain the required
results. Candidates were expected to draw the following table.
Class Interval |
f |
Class Mid-point x |
fx |
fx2 |
60 – 64 |
2 |
62 |
124 |
7688 |
65 – 69 |
3 |
67 |
201 |
13467 |
70 – 74 |
6 |
72 |
432 |
31104 |
75 – 79 |
11 |
77 |
847 |
65219 |
80 – 84 |
8 |
82 |
656 |
53792 |
85 – 89 |
7 |
87 |
609 |
52983 |
90 – 94 |
2 |
92 |
184 |
16928 |
95 – 99 |
1 |
97 |
97 |
9409 |
|
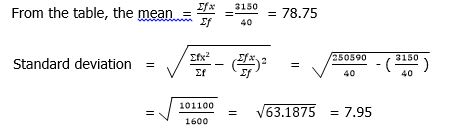
Σf = 40 |
|
Σf = 3150 |
Σfx2 = 250,590 |
|
|
|
|

