
Question 7
The table is for the relation y = px2 – 5x + q.
x |
-3 |
-2 |
-1 |
0 |
1 |
2 |
3 |
4 |
5 |
y |
21 |
6 |
|
-12 |
|
|
|
0 |
13 |
- (i) Use the table to find the values of p and q;
(ii) Copy and complete the table.
- Using scales of 2 cm to 1 unit on the x-axis and 2 cm to 5 units on the y-axisdraw the graph of the relation for -3 £ x £ 5.
- Use the graph to find:
- y when x = 1.8;
- x when y = -8.
Observation
The Chief Examiner reported that this question was attempted by majority of the candidates. Some of the weaknesses observed from candidates who attempted this question included their inability to obtain the equation using values from the table and their inability to read from the graph.
In part (a), Candidates were expected to obtain the values for p and q by substituting two values of x and the corresponding values of y into the equation and solve simultaneously. For instance, when x = 0, y= -12. Therefore, -12 = p(0)2 – 5(0) + q. This implied that -12 = 0 + q which gave q = -12. When x = 4, y = 0 and q = -12, 0 = p(4)2 - 5(4) – 12. i.e. 0 = 16p – 32. Hence, p = 2. Therefore, the equation was y = 2x2 -5x – 12. Candidates would then use this equation to compute the other values of y and complete the table
X |
-3 |
-2 |
-1 |
0 |
1 |
2 |
3 |
4 |
5 |
y |
21 |
6 |
-5 |
-12 |
-15 |
-14 |
-9 |
0 |
13 |
Using this table, they would draw the required graph
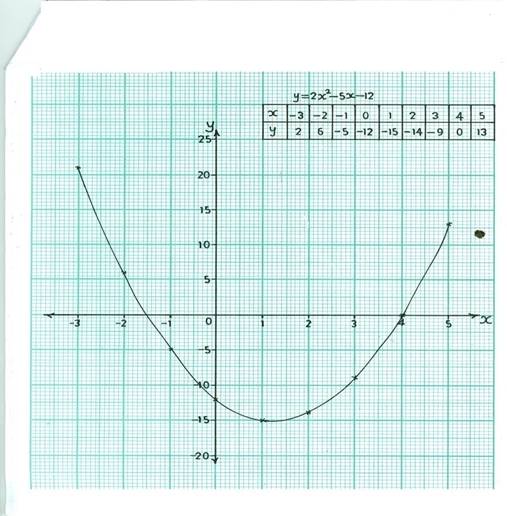
From the graph, y = -14.5 (± 0.5) when x = 1.8. In the same way, when y = -8, x = -0.65 and 3.2 (± 1).