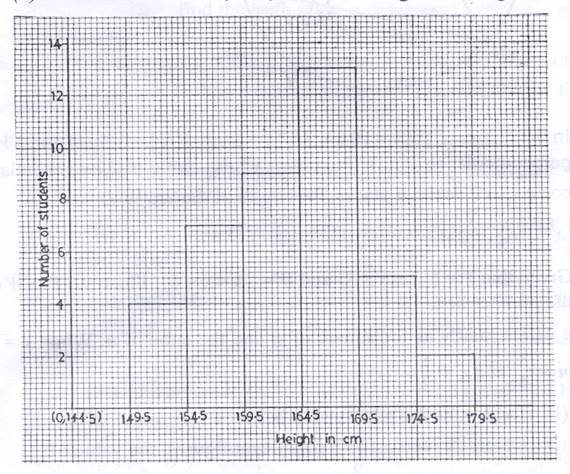
This question was reported not to be attempted by majority of the candidates and majority of those who attempted it performed poorly. They were reported not to obtain the correct frequency table. Candidates were expected to obtain the following table:
Class Boundary |
Class Interval |
Frequency |
Class Mark ( |
fx |
144.5-149.5 |
145-149 |
0 |
147 |
0 |
149.5-154.5 |
150-154 |
4 |
152 |
608 |
154.5-159.5 |
155-159 |
7 |
157 |
1099 |
159.5-164.5 |
160-164 |
9 |
162 |
1458 |
164.5-169.5 |
15-169 |
13 |
167 |
2171 |
169.5-174.5 |
170-174 |
5 |
172 |
860 |
174.5-179.5 |
175-179 |
2 |
177 |
354 |
|
|
 = 40 = 40
|
|
 =6550 =6550
|
From the table, the number of students with heights between 159.5 cm and 164.5 cm = 9. Total number of students = 40. Therefore percentage of students with heights between 159.5 cm and 164.5 cm =

x

= 22

or 22.5%. Mean height =

=

= 163.5 cm