The diagrams labelled I, II and III below are illustration of fingerprints of three individuals.
Study the diagrams and use them to answer questions 2(a) to 2 (b).
Diagrams:
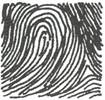
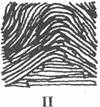
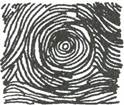
I III
(a) (i) Which type of variation is represented by the diagrams?
…………………………………………...........................................................................................
................................................................................................................................
[2 mark ]
(ii) Classify diagrams I, II and III
I ......................................................................................................
II ......................................................................................................
III .....................................................................................................[3 mark ]
(iii) Give the reasons for your classifications in 2(a)(ii) above
............................................................................................................[ 1 mark ]
(b) State and explain the application of this variation
…………………………………………………………………………………........................................
………………………………………………………………………………………………………………………………….
..............................................................................................................
.................................................................................................................
[5 marks]
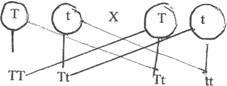
(c) The genetic diagram below is that of a tall cowpea plant which was crossed with a dwarf
cowpea plant. Study the diagram and use it to answer questions 2( c) to 2( d)
TT X tt -IV
-V
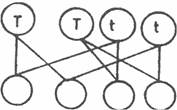 -VI
-VI
Key - T - Tallness
t - Shortness
(i) What do the labels IV, V and VI represent in the diagram?
IV. ................................................……………………………………………………………………………….
V. …………………………………………………………………………………………………………………………………………
VI. ……………………………………………………………………………………………………………………………………….. [ 3 marks]
(ii)
What is the genotype of the individuals in VI?
………………………………………………………………………………………………………………………………………..[ 1 mark]
(iii) Which of the Mendelian laws of inheritance does the diagram represent?
…………………………………………………………………………………………………………………………………………. [4 marks]
(d) (i) Using a genetic diagram illustrate a self cross between two of the individuals labelled VI
(ii) Assuming that 400 offspring arise from the cross in 2( d)(i) above, deduce how many of
them will be tall?
.....................................................................................................................................
....................................................................................................................................
..................................................................................................................................
[ 3 mark ]


 Genotype Phenotype