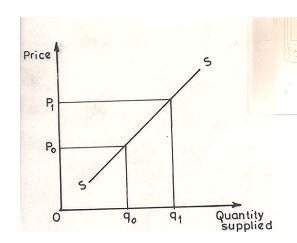
A good number of candidates attempted this question and scored above average. Few of the candidates could not cite relevant examples to explain competitive supply in the (a) part and the figures used as price and quantity supplied in the supply schedule did not conform to the law of supply, hence a normal supply curve could not be derived in the (b) part. Many candidates could not really explain how the factors listed in the(c) part of the question will affect supply of a commodity
The candidates were expected to answer thus:
(a) Competitive supply is when two or more products are produced using the same resources such that an increase in the production of one leads to reduction in the supply of the other.
(b) A supply schedule is a table showing the various prices and quantities of a commodity which sellers are willing to offer for sale at a given period.
Illustration
| Price($) |
Quantity Supplied(tonnes) |
| 10 |
100 |
| 9 |
80 |
| 8 |
50 |
While a supply curve is graphical representation of various quantities of a commodity which sellers are willing to offer for sale at various prices.

(c) (i) An improvement in technology would raise the productivity of inputs and increase production, all things being equal. As production increases, supply would increase.
(ii) A rise in input prices would increase the cost of production. All things being equal, production would decrease and supply would decrease.
(iii) A rise in the price of other commodity would make their production more profitable, all things being equal. As a result, resources would shift into the production of these commodities and decrease the production and supply of the other commodity.
(iv) An increase in government subsidies on production will reduce the cost of production which will lead to an increase in the production and supply of the product. |


