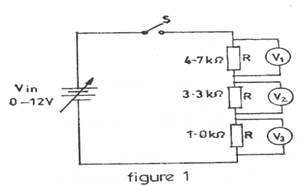
The candidates were  expected to connect the circuit as shown, measure and record the voltmeter  readings, plot the graphs of voltages against each other, determine the slopes  of the graphs and do some comparison.
The expected answers were         
 (c)                                                      Table  1 


                          Vin(V)  | 
                        V1(V)  | 
                        V2(V)  | 
                        V3(V)  | 
                      
                      
                        2  | 
                        1.04  | 
                        0.73  | 
                        0.22  | 
                      
                      
                        4  | 
                        2.09  | 
                        1.47  | 
                        0.45  | 
                      
                      
                        6  | 
                        3.13  | 
                        2.20  | 
                        0.67  | 
                      
                      
                        8  | 
                        4.18  | 
                        2.93  | 
                        0.89  | 
                      
                      
                        10  | 
                        5.22  | 
                        3.67  | 
                        1.11  | 
                      
                    
                    (j)      Comparison: The voltage divides in direct  proportion to the values of R2  
       and R1.
                    
                      The Chief Examiner reported  that the many candidates showed good knowledge of components’ connection but  were inadequate in the given answers.