Question 5
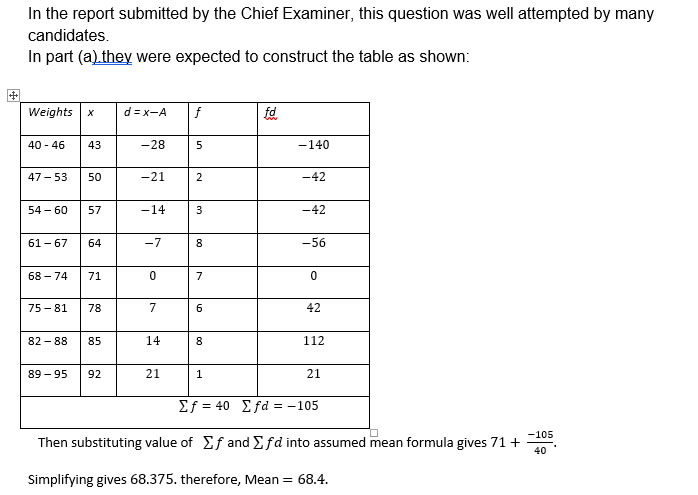
The table shows the distribution of weights(N) of students in a class.
Weights (N) |
40 - 46 |
47 - 53 |
54 - 60 |
61 - 67 |
68 - 74 |
75 - 81 |
82 - 88 |
89 - 95 |
Frequency |
5 |
2 |
3 |
8 |
7 |
6 |
8 |
1 |
Observation

