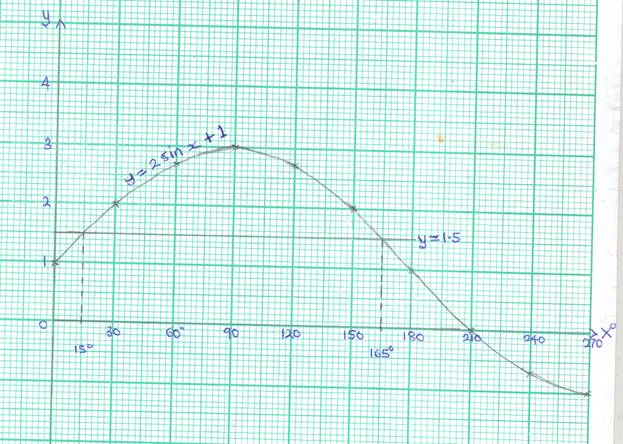
The Chief Examiner reported that majority of the Candidates attempted this question. The report further stated that while majority of them were able to complete the table and draw the graph, they could not obtain the value of x for which .Candidates were encouraged to work harder in this aspect. They were expected to obtain the following table of values

|

|

|

|

|

|

|

|

|

|

|

|
1.0 |
2.0 |
2.7 |
3.0 |
2.7 |
2.0 |
1.0 |
0.0 |

|

|
Using these values and the given scales, they were to draw the graph as shown:

Candidates would now find the value of x for which  using the graph as follows:
  . This implied that 2
 . 2
. 2 or 1.5 Therefore, the line
  would be traced to intersect with the graph.
The x – coordinates of the points of intersection of the graph and the line y = 1.5 gave the required solution which was 


