Question 11
The table shows the distribution of the number of hours per day spent in studying by 50 students.
Number of hours per day |
4 |
5 |
6 |
7 |
8 |
9 |
10 |
11 |
Number of students |
5 |
7 |
5 |
9 |
12 |
4 |
3 |
5 |
Calculate, correct to two decimal places, the:
- mean;
- standard deviation.
Observation
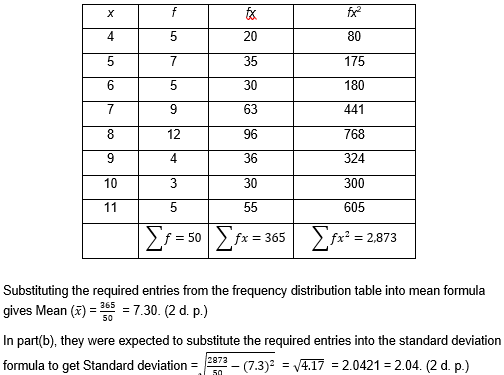
The Chief Examiner reported that this question was popular with the candidates. Most candidates who attempted this question were able to get the mean but were not able to get the standard deviation because of error in the frequency distribution table.
In part (a) (i), they were expected to construct the frequency distribution table as shown:

