Question 11
Marks |
2 |
3 |
4 |
5 |
6 |
Frequency |
n-2 |
n - 1 |
n - 3 |
2n - 6 |
8 - n |
The table shows the distribution of marks scored by students in a test.
- If the mean mark is 3.75, find the value of n.
- Find the:
- Interquartile range;
- Probability of selecting a student who scored at least 3 marks.
Observation
The Chief Examiner reported that this question was popular with the candidates. Most candidates who attempted this question performed creditably well.
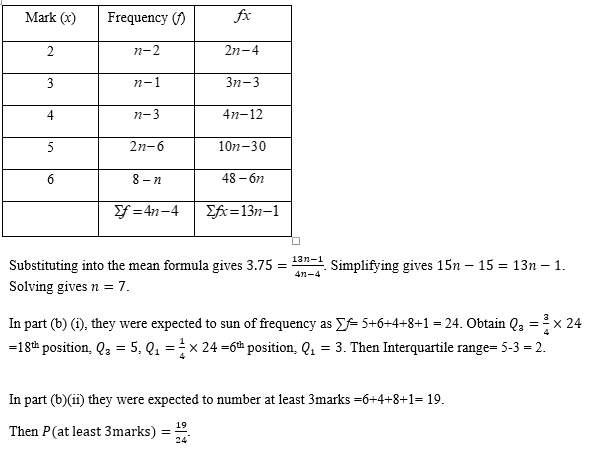
In part (a), they were expected to construct the table as shown:

