Question 10
Age(years) |
3 |
4 |
5 |
6 |
7 |
8 |
9 |
10 |
Number of Children |
2 |
6 |
5 |
|
6 |
9 |
8 |
5 |
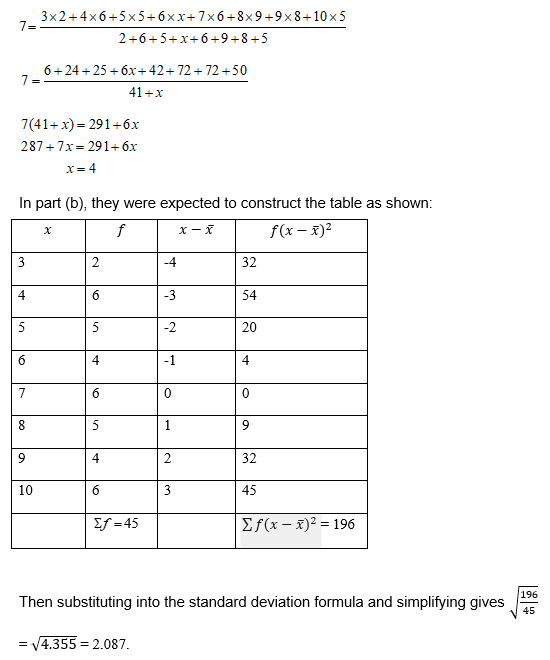
The table shows the distribution of ages of a number of children in a school. If the mean of the distribution is 7, find the:
- A value of ;
- standard deviation of their ages.
Observation
The Chief Examiner reported that the performance of candidates who attempted this question was encouraging because many were able to solve it correctly.
In part(a), they were expected to substitute into the mean formula, simplify and solve as shown:

