Question 11
The table shows the frequency distribution of the ages of fifty members of a family.
Ages(years) |
1-5 |
6-10 |
11-15 |
16-20 |
21-25 |
26-30 |
Frequency |
|
|
|
|
|
10 |
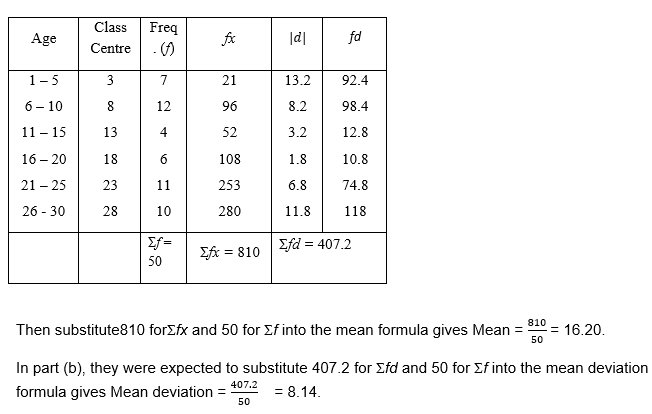
Calculate, correct to two decimal places, the:
- mean ;
- mean deviation of the distribution.
Observation
The Chief Examiner reported that this question was popular with the candidates. Most candidates who attempted this question performed creditably well in finding the mean.
While finding the mean deviation was challenging to most candidates because of lack of knowledge of absolute values.