Question 1
AIM: To investigate the effect of resistance on voltage in a d.c. circuit.

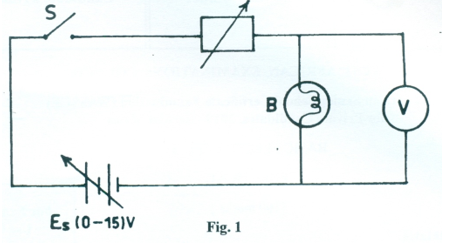
- Connect the circuit as shown in Fig.1.
- Ask the supervisor to check the circuit connection.
- You are provided with Table 1
- Set the variable power supply to 6 V.
- Set the resistance box to 0 Ω.
- Close switch S.
- Read and record in Table 1 the voltmeter reading.
- Set the resistance box to 1 Ω and repeat step (g).
- Repeat step (h) for the other resistance values in Table 1.
- Plot the graph of voltage (V) on the vertical axis against resistance (Ω) on the horizontal axis.
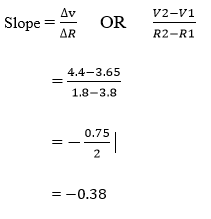
- Determine the slope of the graph.
- Compare the brightness of the bulb B when the resistance box is set to 1 Ω with when it is set to 15 Ω. State the reason for the observation.
- What does the slope of the graph represent?
| Resistance (Ω) | Voltage (V) |
| 0 | |
| 1 | |
| 5 | |
| 10 | |
| 15 | |
| 20 |
Observation
The expected responses were:
| Resistance (Ω) | Voltage (V) |
| 0 | 5.9 |
| 1 | 4.4 |
| 5 | 3.3 |
| 10 | 2.3 |
| 15 | 1.6 |
| 20 | 1.2 |
- Correct circuit connection
- Graph sheet
- Axes
- Scale
- Points
-

- Comparison on brightness of bulb
At 1Ω the bulb is very bright while at 15Ω the bulb becomes dim. This is because the resistance to the flow of current is increased from 1Ω to 15Ω. - The slope of the graph represents the current (I) flowing through the circuit.
