Question 1
AIM: To verify the effect of filtering in power supply units.

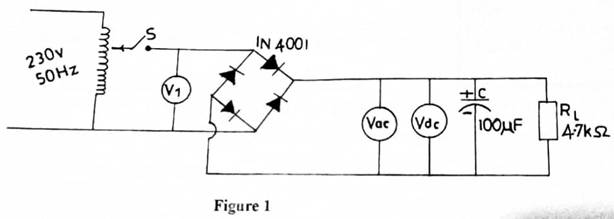
- Connect the circuit as shown in Figure 1.
- Ask the supervisor to check the circuit connection.
- You are provided with Table 1.
Table 1
C (µF) |
V1 (V) |
Vac (V) |
Vdc (V) |
100 |
6.0 |
|
|
220 |
6.0 |
|
|
330 |
6.0 |
|
|
470 |
6.0 |
|
|
1000 |
6.0 |
|
|
- Set the output voltage, V1 of the variac to 6 V.
- Close switch S.
- Read and record in Table 1 the values of voltmeters Vacand Vdc .
- Open switch S.
- Replace the capacitor in the circuit with the capacitor values in Table 1.
- Repeat steps (e) to (h) for the capacitor values in Table 1.
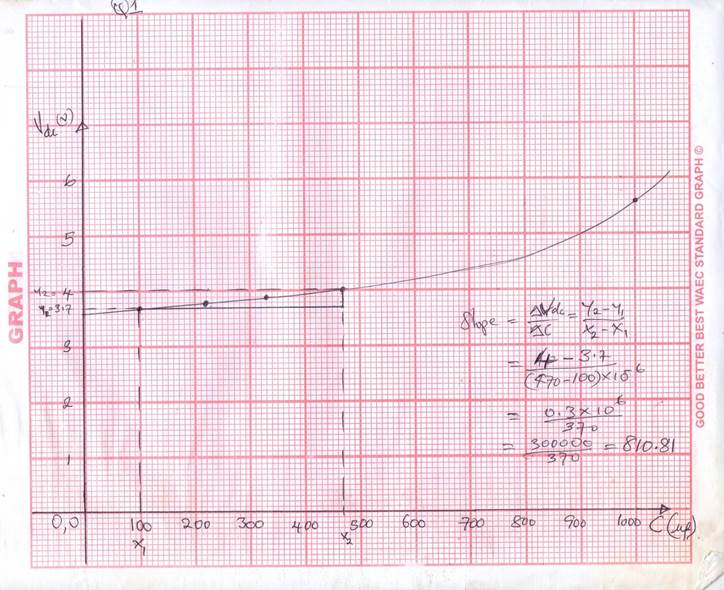
- Plot the graph voltage Vdc (V) on the vertical axis against capacitance C (µF) on the horizontal axis.
- Determine the slope of the graph.
- From the slope, comment on the approximate relationship between the output voltage of the power supply, Vdc and capacitance C.
- From your readings, comment on Vdc and Vac in relation with the capacitance, C
Observation
The expected answers were:
TABLE 1
C (µF) |
V1(V) |
Vac(V) |
Vdc(V) |
100 |
6.0 |
2.282 |
3.744 |
220 |
6.0 |
2.216 |
3.791 |
330 |
6.0 |
2.140 |
3.868 |
470 |
6.0 |
1.971 |
4.012 |
1000 |
6.0 |
0.599 |
5.569 |
- Circuit connection
- Correct reading of Vac (V)
- Correct reading of Vdc (V)
- Correct axes
- Reasonable scale
- Plotting of points
- Line of best fit
- Determination of slope
- Relationship between Vdc and Capacitance, C
- Relationship between Vdc and Vac in relation with C
.GRAPH AND CALCULATIONS

The question required candidates to build a circuit using the apparatus provided in order to verify the effect of filtering in a power supply unit.
Many candidates showed understanding of the requirements as they successfully conducted the experiment, obtained required readings, plotted the graph and made the required deductions. However, many candidates also obtained inaccurate readings, failed to choose reasonable scales to represent readings, plotted incorrect graphs, and could not correctly determine the slope of the graph.
