Question 2
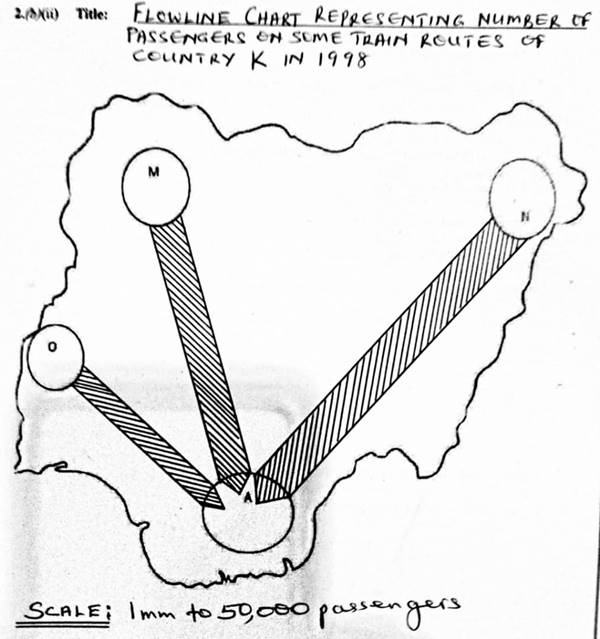
The table below shows the number of passengers on some train routes of country K in the year 1998.
Transport Route |
Number of Passengers |
M – A |
450,000 |
N – A |
550,000 |
O – A |
300,000 |
(a)(i) Using the map of Country K on page 4 and a scale of 1mm to 50,000 passengers, draw a flowline chart to represent the data.
(ii) Provide a suitable title for the flowline chart you have drawn.
(b) State two disadvantages of flowline charts.
Observation
This question was attempted by few candidates and many of those that attempted it performed poorly. A good proportion of those who attempted it could not use the given scale to obtain the thickness of the flow line. The required calculation is:
![]() Calculating the width of line M A
Calculating the width of line M A
450,000/50,000 = 9 mm = 2 marks
![]() Calculating the width of Line N A
Calculating the width of Line N A
550,000/50,000 = 11 mm = 2 marks
![]() Calculating the width of Line O A
Calculating the width of Line O A
300,000/50,000 = 6 mm = 2 marks

