Question 6


Observation
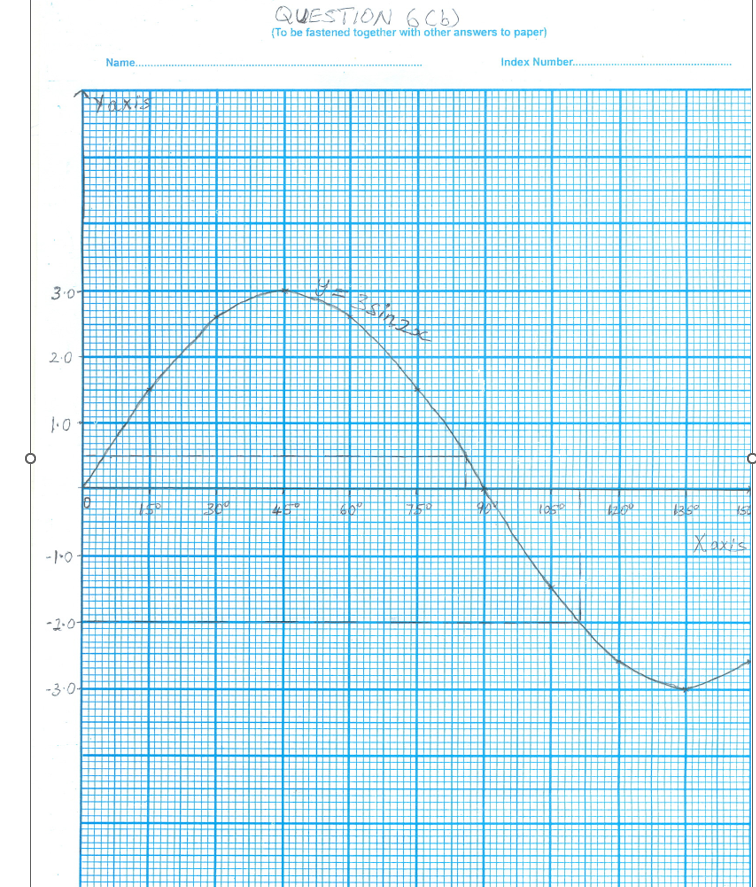
The Chief Examiner reported that majority of the candidates’ who attempted this question did not plot the points after completing the table of values and many of them even completed the table with wrong values for y.
In part (a), they were expected to complete the table of values as shown:
x |
00 |
150 |
300 |
450 |
600 |
750 |
900 |
1050 |
1200 |
1350 |
1500 |
y |
0.0 |
1.5 |
2.6 |
3.0 |
2.6 |
1.5 |
0.0 |
-1.5 |
-2.6 |
-3.0 |
-2.6 |
In part (b), the expected graph for the relation is as shown

