Question 11
Age (years) |
1 |
2 |
3 |
4 |
5 |
6 |
7 |
8 |
9 |
10 |
Number of Pupils |
12 |
14 |
20 |
45 |
36 |
20 |
23 |
16 |
8 |
6 |
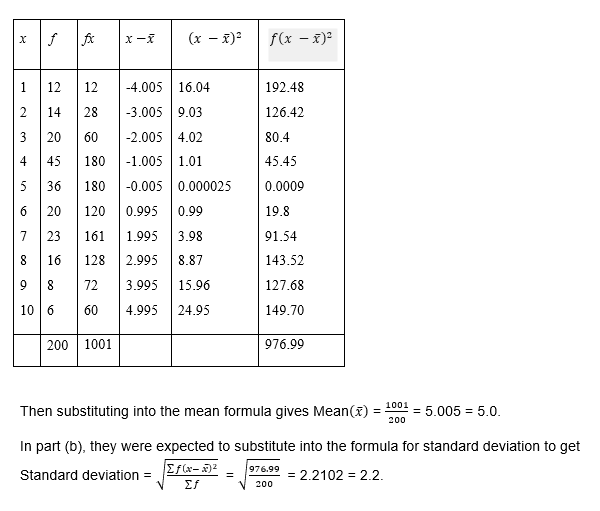
The table is a frequency distribution of ages of 200 pupils in a school. Find, correct to one decimal place, the:
- mean;
- standard deviation,
of the distribution.
Observation
The Chief Examiner reported that most candidates who attempted this question had difficulty in obtaining standard deviation but were able to calculate the mean.
In part(a), they were expected to construct to frequency table as shown: