Question 1
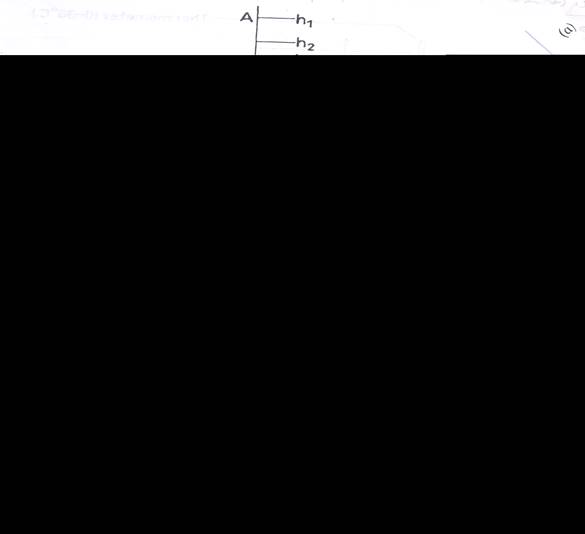
An object, Q of mass, m was released from a height and allowed to fall freely unto a vertical spring of natural length,  o as shown in the diagram above. The length,
  of the compressed spring was recorded. The height, h of the object above the spring was also recorded. The procedure was repeated with the object falling from the same height.
The whole procedure was repeated for four other values of h. In each case,  was measured twice.
Figure 1(a) shows the heights, hi of the object above the spring while figures 1(b) and 1(c) are scaled diagrams of the spring showing the compressed lengths,  i for the first and second readings respectively, where
 = 1,2,3,4 and 5 respectively.
- The length AB in figure 1(a) represents the maximum height,hi = 4.5m, of the object above the spring. Deduce the scale of the figure and use it to determine and record the values of h2,h3,h4 and h5 respectively.
- Measure and record the corresponding values of
 for the two sets.
- Determine and record the mean value of
 in each case.
- Evaluate e =
 o –
o –  mean in each case. Also evaluate e2
- Tabulate your readings
- Plot a graph with h on the vertical axis and e2 on the horizontal axis.
- Determine the slope, s, of the graph.
- From the graph, deduce the compression that would be produced when the object is dropped from a height of 3.6m.
- State two precautions that are necessary to ensure accurate results when performing this experiment.

(b) (i) A spring of force constant 300 Nm-1 is compressed such that
its length shortens by 3.0cm. Calculate the energy stored in
the spring.
(ii) The table below shows that loads that hung on a spring
balance caused the pointer to move to the indicated marks.
Load/N |
5 |
10 |
F |
Mark/cm |
8 |
12 |
30 |
Calculate the value of F that will move the pointer to the 30 cm mark.
This question was the least popular among the candidates. Candidates were required to determine the scale factor used in the diagram. The determination of the scale factor was a major problem to most candidates as they appeared not to know how to go about this. Out of the few that got the scale right, some could not evaluate the value of e2 to the required degree of 3 significant figure. Determination of lmean was poorly handled by most responding candidates. The graph and deductions of e from the graph even when they got e graphically was poorly done. Many candidates could not state satisfactorily precautions relevant to the experiment.
Part (b)(i) Most candidates were able to calculate the energy stored in the spring
(ii) This was poorly handled.


