Question 10
Observation
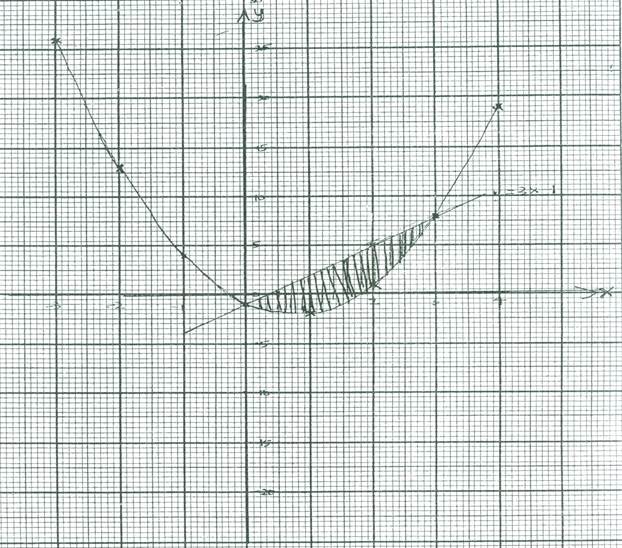
The Chief Examiner reported that although majority of the candidates attempted this question, their performance was poor. Majority of the candidates were reported not to draw the graph. Others who were able to draw the graph were reported not to attempt the questions that followed. Candidates were expected to obtain the following table
x |
-3 |
-2 |
-1 |
0 |
1 |
2 |
3 |
4 |
y |
26 |
13 |
4 |
-1 |
-2 |
1 |
8 |
19 |
Using this table and the given scales, they would draw the graph.

