Question 1
Question 1
AIM: The aim of both experiments is to determine the relationship between the collector current (Ic) and base current (Ib) of a common emitter transistor configuration.

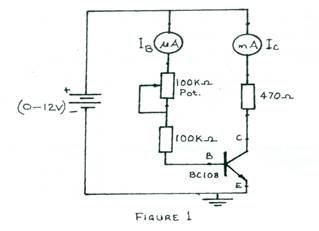
- Connect the circuit diagram as shown in Figure 1.
- Ask the Supervisor to check the circuit connection.
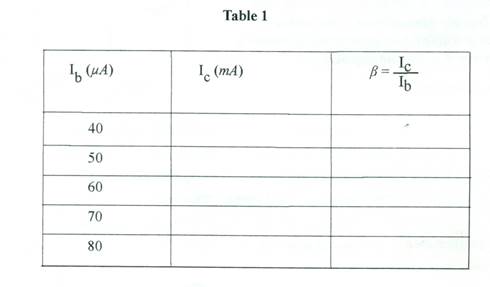
- Copy Table 1 into your answer booklet.

- Switch on the power supply unit.
- Set the power supply unit to 9V.
- Adjust the potentiometer to set the value of Ib to 40µA.
- Read and record the corresponding value of Ic in Table 1.
- Repeat steps (f) and (g) for the other values of Ib in Table 1.
- Switch off the power supply unit.
- Complete Table 1 by calculating the value of β.
- Plot a graph of Ic (mA) on the vertical axis against Ib (µA) on the horizontal axis.
- Determine the slope of the graph.
The candidates were expected to connect the circuit as shown, measure and record the values as indicated in Table 1. Interpretations and deductions were expected to be made from the values recorded by respective candidates only.
The expected answers were:
Table 1
Ib (mA) |
Ic (mA) |
β = IC/Ib |
40 |
12.495 |
312.38 |
50 |
14.808 |
296.16 |
60 |
17.573 |
296.16 |
70 |
18.760 |
268.00 |
80 |
18.835 |
235.44 |
(k) Graph drawn from values provided in Table 1 by candidate.
(l) Slope calculated from graph drawn by candidate.
Majority of the candidates were able to observe and record the readings. However, some
found it difficult to plot the required graph from the readings taken.
Observation
The expected answers were:
The candidates were expected to connect the circuit as shown, measure and record the values as indicated in Table 1. Interpretations and deductions were expected to be made from the values recorded by respective candidates only.
The expected answers were:
Table 1
Ib (mA) |
Ic (mA) |
β = IC/Ib |
40 |
12.495 |
312.38 |
50 |
14.808 |
296.16 |
60 |
17.573 |
296.16 |
70 |
18.760 |
268.00 |
80 |
18.835 |
235.44 |
(k) Graph drawn from values provided in Table 1 by candidate.
(l) Slope calculated from graph drawn by candidate.
Majority of the candidates were able to observe and record the readings. However, some
found it difficult to plot the required graph from the readings taken.
