
Question 12
Observation
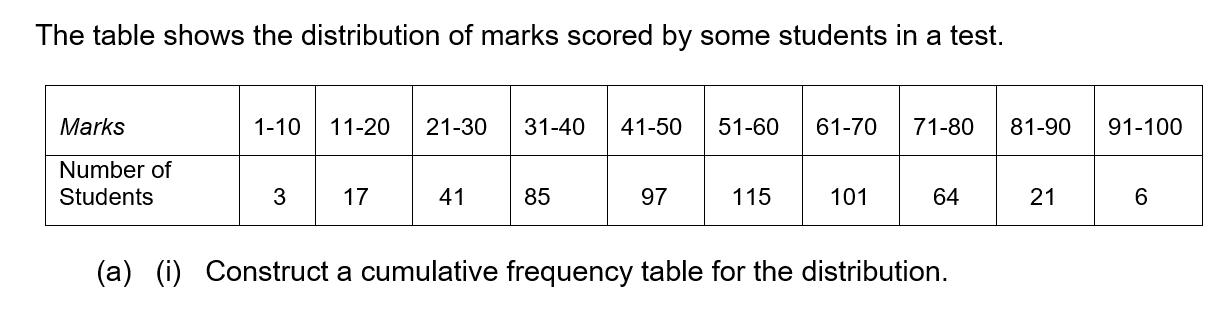
The Chief Examiner reported that Majority of the candidates were able to construct the cumulative frequency table. Some were reportedly able to draw the cumulative frequency curve but majority of them were reported not to read from the graph correctly. Teachers were encouraged to lead candidates to read from graphs.
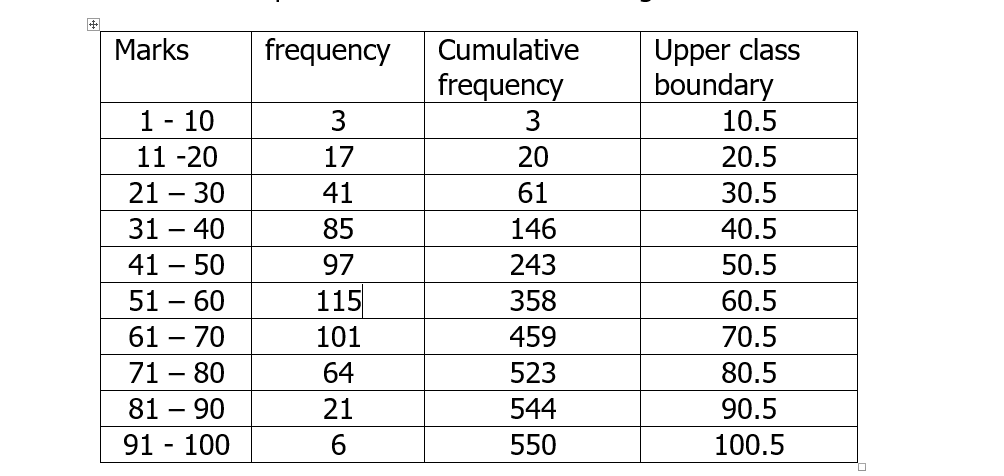
Candidates were expected to obtain the following table:
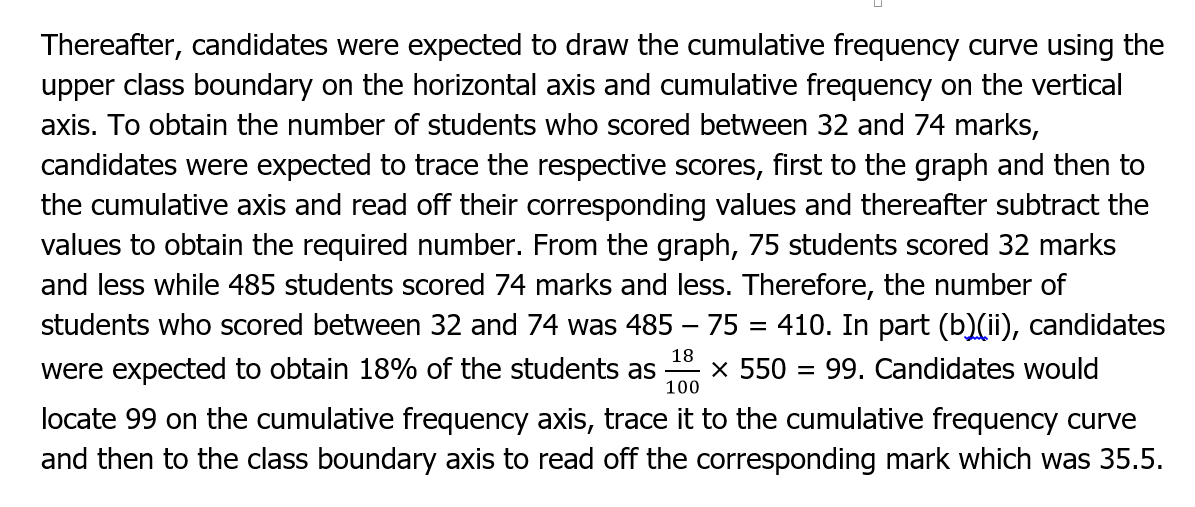
To determine the lowest for distinction, if 8% passed with distinction, then 92% did not pass. Candidates were therefore to obtain 92% of the students as × 550 = 506. Locating 506 on the cumulative frequency axis and tracing it to the marks axis gave the minimum mark as 77.5.