
Question 12
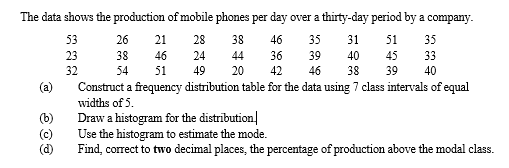
Observation
The Chief Examiner observed that few of the Candidates’ who attempted this question got it right. However, most could not construct the frequency distribution table required.
In part (a), the required frequency distribution table using 7 class intervals of equal widths of 5 is:
Class Interval |
Tally |
Freq |
Class boundaries |
20 -24 |
//// |
4 |
19.5 – 24.5 |
In part (b), the histogram for the distribution is:
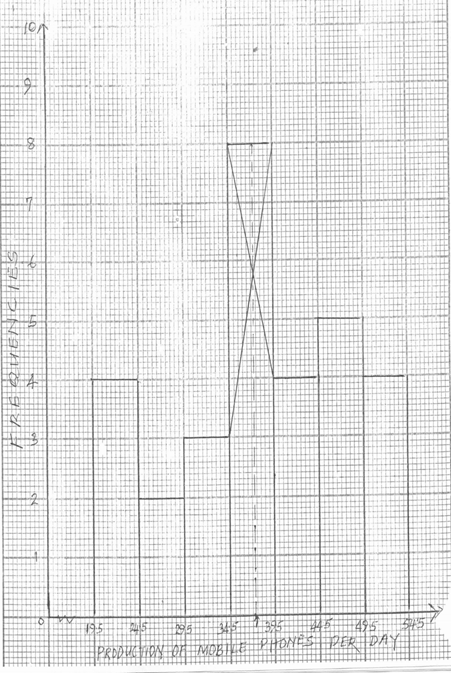
In part (c), using the histogram, the estimate of the mode is 37.25
In part (d), the percentage of the production above the modal class = 100% = 43.33%.