Question 7
The table shows the age distribution in years of a group of people.
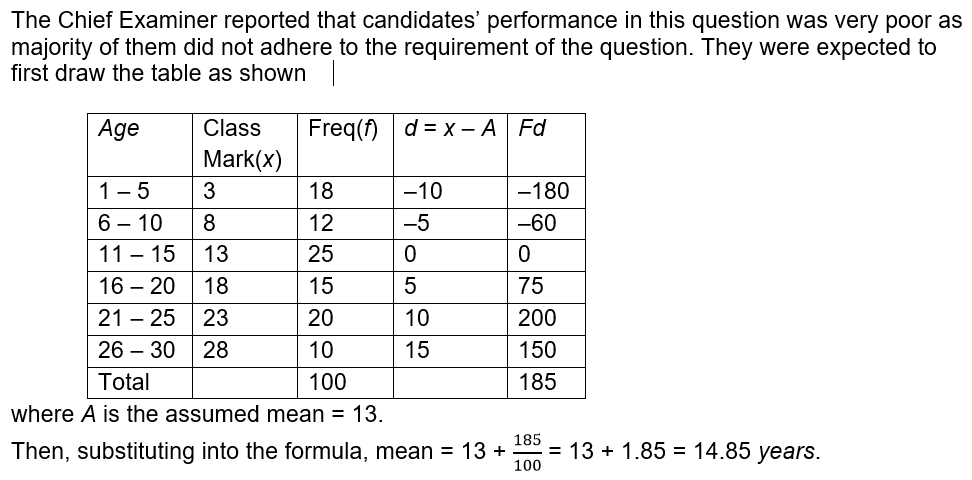
Using an assumed mean of 13 years, find the mean age of the people.
| Age (in years) | 1 – 5 | 6 – 10 | 11 – 15 | 16 – 20 | 21 – 25 | 26 – 30 |
| Number of people | 18 | 12 | 25 | 15 | 20 | 10 |
Using an assumed mean of 13 years, find the mean age of the people.
Observation