
Question 7
The following are the scores of 48 students in a promotion test.
| 52 | 56 | 25 | 56 | 68 | 73 | 66 | 64 | 56 | 48 | 15 | 88 | 20 | 39 | 9 | 50 | 98 | 54 | 54 | 40 | 50 | 96 |
| 53 | 16 | 36 | 44 | 18 | 97 | 65 | 21 | 60 | 44 | 54 | 32 | 84 | 52 | 92 | 49 | 37 | 94 | 72 | 88 | 89 | 35 |
| 59 | 34 | 72 | 60 |
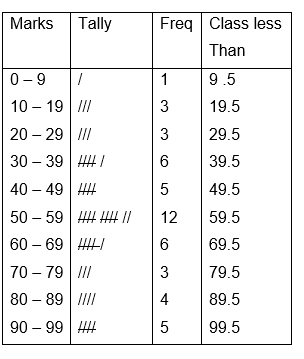
- Construct a frequency distribution table using the class interval 0 – 9, 10 – 19, 20 – 29, ….
- If the pass mark for promotion is 30, find, correct to one decimal place, the percentage of students who will be promoted.
- Draw a histogram for the distribution.
- Use the histogram to estimate the modal score.
- If the pass mark for promotion is 30, find, correct to one decimal place, the percentage of students who will be promoted.
Observation
The Chief Examiner reported that only a negligible percentage of the candidates’ got the full marks allocated as majority of them
ignored the class boundaries and also failed to use the graph to estimate the modal score.
In part (a), they were able to construct the required frequency distribution as shown.
In part (b), using the frequency distribution table, they were expected to draw the histogram as shown
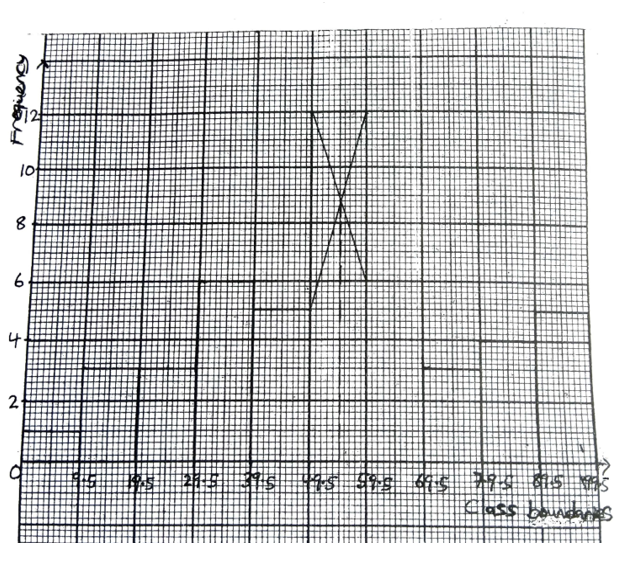
In part (c) (i), using the graph, the estimate of the modal score is = 54.5 1.
In part (b) (ii), the number of students that passed = 6 + 5 + 12 + 6 + 3 + 4 + 5 = 41.
Therefore, percentage of students who passed = = 41 ⁄ 48 ×100 = 85.4%.