
Question 3
The frequency distribution shows the range of prices of a brand of a car sold by a dealer and the corresponding quantity demanded. 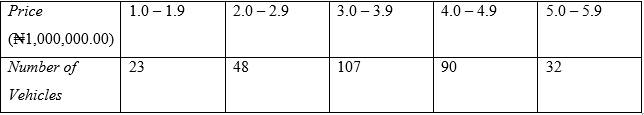
- Represent the information in a histogram.
- Use the histogram to determine the most preferred selling price for the brand of car.
Observation
The Chief Examiner reported that Candidates’ performance on this question was very poor as majority of them didnot use the proper scale which was class boundaries.
Also, instead of drawing a histogram, some drew bar chart. In part (a), the expected table with class boundaries was 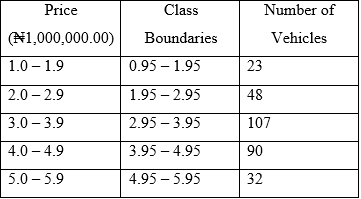
And the required histogram was 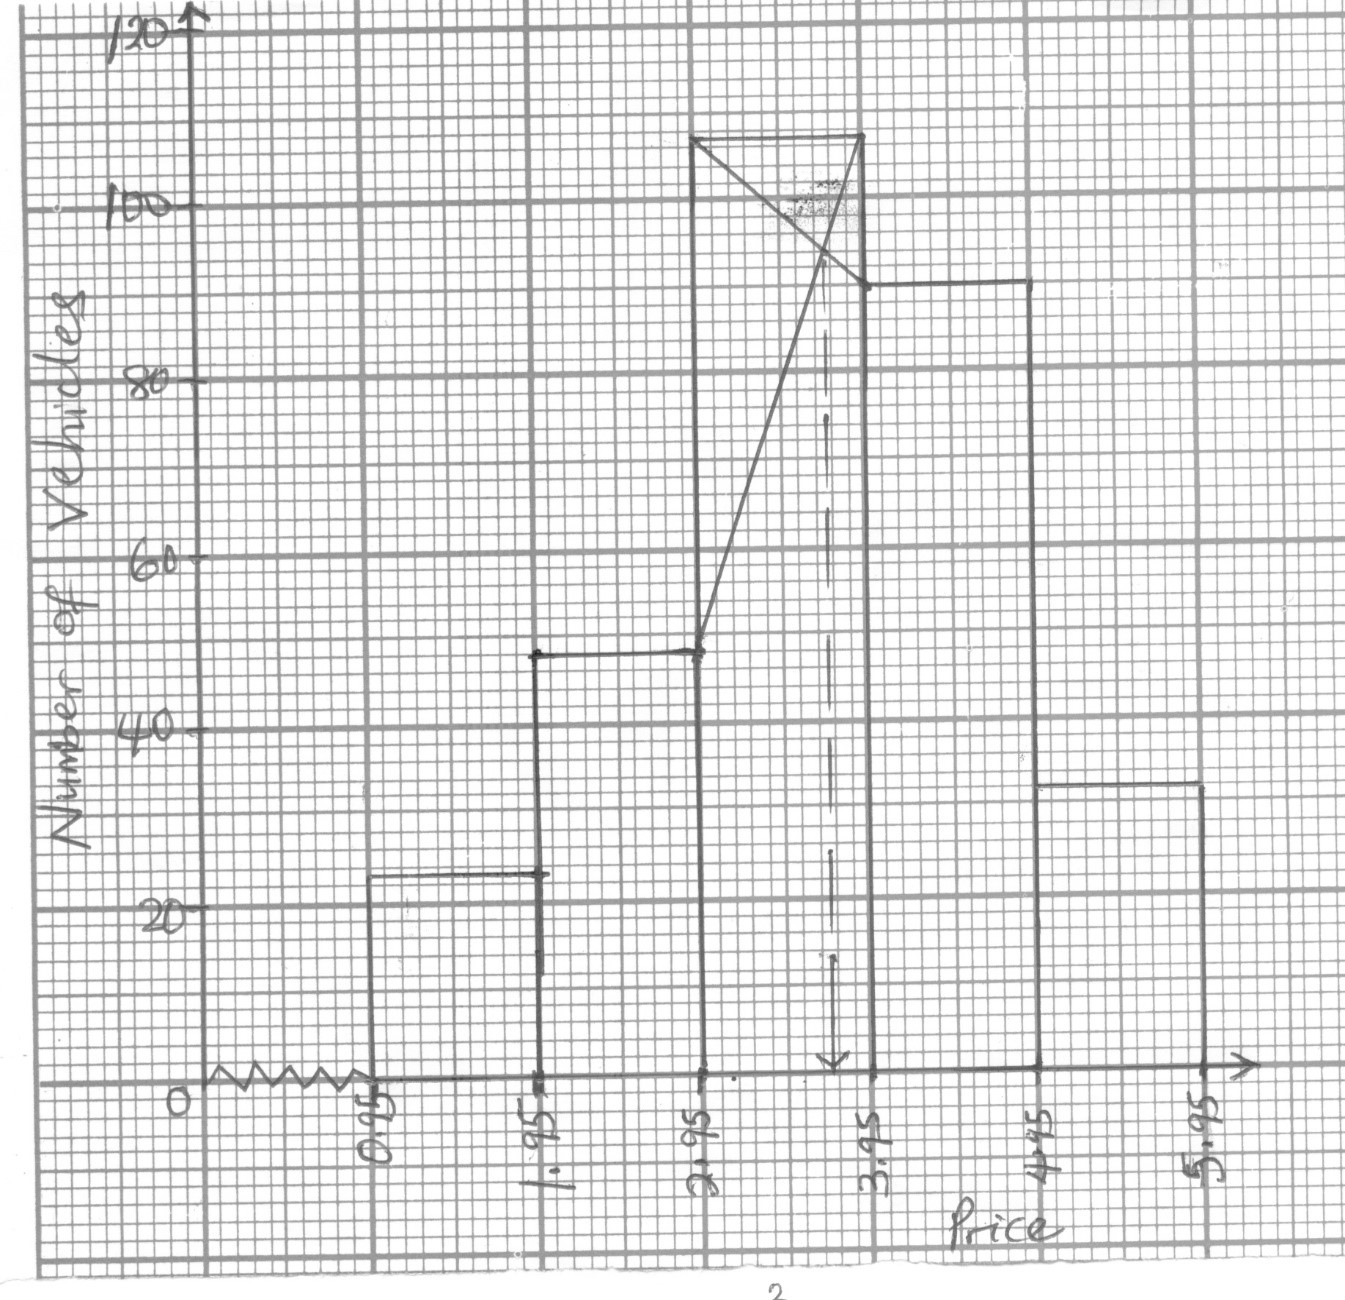
In part (b), from the graph, the most preferred selling price for the brand of car is
2.95 + 0.75 = 3.70 = ₦1,000,000 × 3.70 = ₦3,700,000.00