
Question 5
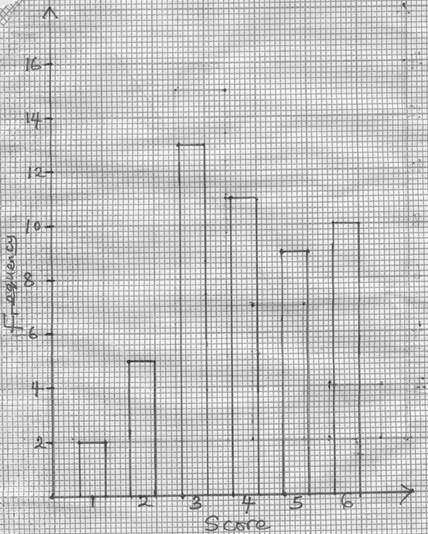
The table shows the distribution of scores obtained when a fair die was rolled 50 times.
-
Score1
2
3
4
5
6
Frequency
2
5
13
11
9
10
- Draw a bar chart for the distribution.
- Calculate the mean score of the distribution.
Observation
The Chief Examiner reported that most of the Candidates’ could not differentiate between bar Chart and histogram. However, they were able to determine the mean of the distribution.
In part (a), the bar chart for the distribution is as shown
In part (b), they were able to construct the frequency distribution table as
Score (x) |
1 |
2 |
3 |
4 |
5 |
6 |
Total |
Frequency(f) |
2 |
5 |
13 |
11 |
9 |
10 |
50 |
fx |
2 |
10 |
39 |
44 |
45 |
60 |
200 |
Mean = ![]()