
Question 13
-
Marks
10
20
30
40
50
60
70
80
90
Frequency
1
1
x
5
y
1
4
3
1
The frequency table shows the marks distribution of a class of 30 students in an examination. The mean mark of the distribution is 52.
- Find the values of x and y.
- Construct a group frequency distribution table starting with a lower class limit of 1 and a class interval of 10.
- Draw a histogram for the distribution.
- Use the histogram to estimate the mode.
Observation
The Chief Examiner reported that this question was poorly attempted. As most of the Candidates’ did not go beyond finding the values of x and y.
In part (a), the distribution table is:
x |
f |
fx |
10 |
1 |
10 |
20 |
1 |
20 |
30 |
x |
30x |
40 |
5 |
200 |
50 |
y |
50y |
60 |
1 |
60 |
70 |
4 |
280 |
80 |
3 |
240 |
90 |
1 |
90 |
Total |
16 + x + y |
900 + 30x + 50y |
Since the total number of students is 30, then, we have 16 + x + y = 30
x + y = 14……………………(1)
Also, mean = = 52
900 + 30x + 50y = 832 + 52x + 52y
22x + 2y = 68
11x + y = 34…………………(2)
Solving equations (1) and (2) simultaneously, y = 12 and x = 2.
In part (b), the group frequency distribution table is
Class Interval |
Frequency |
Upper Class Boundary |
1 – 10 |
1 |
10.5 |
11 – 20 |
1 |
20.5 |
21 – 30 |
2 |
30.5 |
31 – 40 |
5 |
40.5 |
41 – 50 |
12 |
50.5 |
51 – 60 |
1 |
60.5 |
61 – 70 |
4 |
70.5 |
71 – 80 |
3 |
80.5 |
81 – 90 |
1 |
90.5 |
In part (c), the histogram is
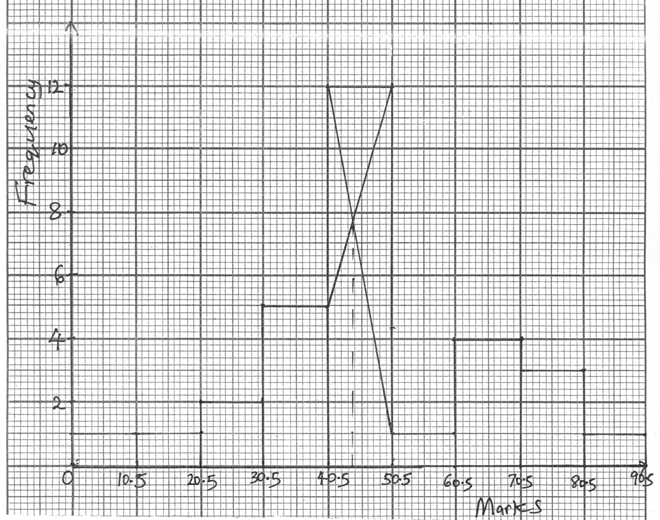
In part (d), from the histogram, the estimate of the mode is 44 (1).