
Alternative A
Question 2A
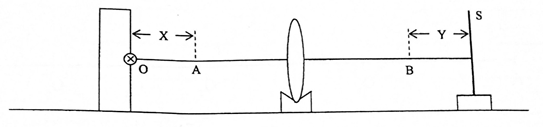
The diagram above illustrates an experimental set-up for the determination of the focal length of a lens. The principal foci A and B of the lens were determined.
The image of an illuminated object O placed at a distance X from A is obtained on a screen S placed a distance Y from B.
The procedure is repeated for five other values of X and the corresponding values of Y were measured and recorded.
Fig. 2(a) on page 8, represents the distances xi between A and the illuminated object O.
Fig. 2(b) on page 8, represents the corresponding distances yi between B and S, where i = 1,2,3,4,5 and 6.
(i) Measure and record the raw values of x = AOi.
(ii) Measure and record the corresponding raw values of y = BSi.
(iii) Use the given scales to convert xiand yi to the real values Xiand Yirespectively.
(iv) In each case, evaluate Y-1
(v) Plot a graph with X on the vertical axis and Y-1 on the horizontal axis.
(vi) Determine the slope, s, f the graph.
 (viii) State two precautions necessary if you were to perform this experiment in the laboratory.
Observation
The expected response:
- Six values of xcorrectly measured and recorded to at least 1 d.p. and within
- tolerance of ± 0.1 cm
- (Award ½ mark each)
- Six values of ycorrectlymeasured and recorded to at least 1 d.p and within
- tolerance of ± 0.1 cm
- (Award ½ mark each)
- Six values of X correctly evaluated
- (Deduct ½ mark for each wrong or missing value)
- Six values of Ycorrectly evaluated
- (Deduct ½ mark for each wrong or missing value)
- Six valves of Y-1 correctly evaluated to 3 dp.
- (Deduct ½ mark for each wrong or missing value)
- Composite table showing at least x,y,x,y,and y-1
- Plot a graph of reasonable scales
- Draw line of best fit
- Determine the slope
- Evaluate k
- State any two of the following precautions
e.g
- Ensure clean lens
- Ensure the lens stands vertically in the holder
- Ensure sharp image of object
- Ensure collinear arrangement of apparatus
- Avoid parallax error on metre rule
- Note zero error on metre rule
- Repeated reading stated