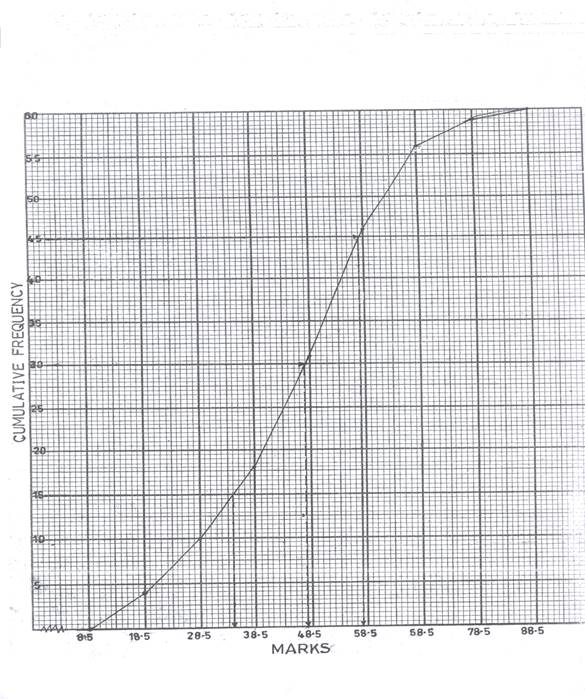
The Chief Examiner reported that majority of the candidates who attempted this question performed well in it. Candidates were reportedly able to obtain the cumulative frequency table and draw the cumulative frequency curve. However, while majority were able to estimate the median, a good number of them were reported not to calculate the inter quartile range correctly.
Candidates were expected to obtain the following table:
Class boundary |
Class interval |
frequency |
Cumulative frequency |
8.5 - 18.5 |
9 - 18 |
4 |
4 |
18.5 - 28.5 |
19 - 28 |
6 |
10 |
28.5 – 38.5 |
29 - 38 |
8 |
18 |
38.5 – 48.5 |
39 - 48 |
13 |
31 |
48.5 – 58.5 |
49 - 58 |
15 |
46 |
58.5 – 68.5 |
59 -68 |
10 |
56 |
68.5 – 78.5 |
69 - 78 |
3 |
59 |
78.5 – 88.5 |
79 - 88 |
1 |
60 |
Using the class boundary and the cumulative frequency, candidates were expected to draw the cumulative frequency as shown:

From the graph, the median was obtained as 47.5± 0.5. The upper quartile was 57.5 (± 0.5); lower quartile was 34.5 (± 0.5). Therefore the interquartile range was 57.5 – 34.5 =23 (± 0.5).


