
Question 2
The utility schedule of a consumer for a brand of ice cream is shown in the table below.
Use the information to answer the questions that follow:
Units Consumed (Q) |
Total Utility (TU) |
Marginal Utility (MU) |
0 |
0 |
-- |
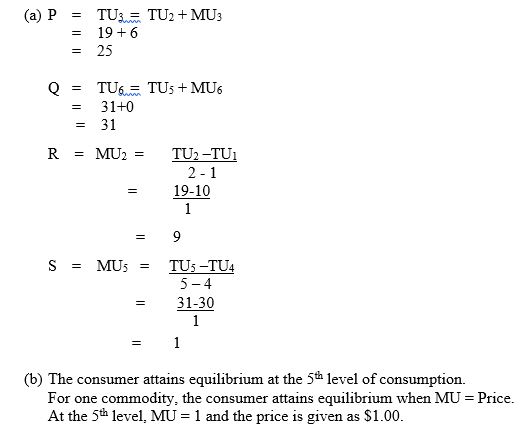
(a) Calculate the values of P, Q, R and S.
(b) Given that the price of ice cream is $1.00 per unit, at what level of consumption is the consumer in equilibrium? Explain your answer.
(c) Using a graph sheet, draw the marginal utility curve.
(d) State the law of diminishing marginal utility.
This is the alternative data response question to question (1) and was quite popular with the candidates. The question required candidates to calculate total utility and marginal utility at various levels of output in the (a) part of the question, determine the level at which the consumer is in equilibrium, draw a marginal utility curve and state the law of diminishing marginal utility in the (b), (c) and (d) part of the question respectively. Most of the candidates could compute the values of total utility and marginal utility in the (a) part of the question but only few of them could draw the correct marginal utility curve. Candidates scored relatively high marks in this question .
The candidates were expected to provide the following answers to obtain the maximum marks.
(c) 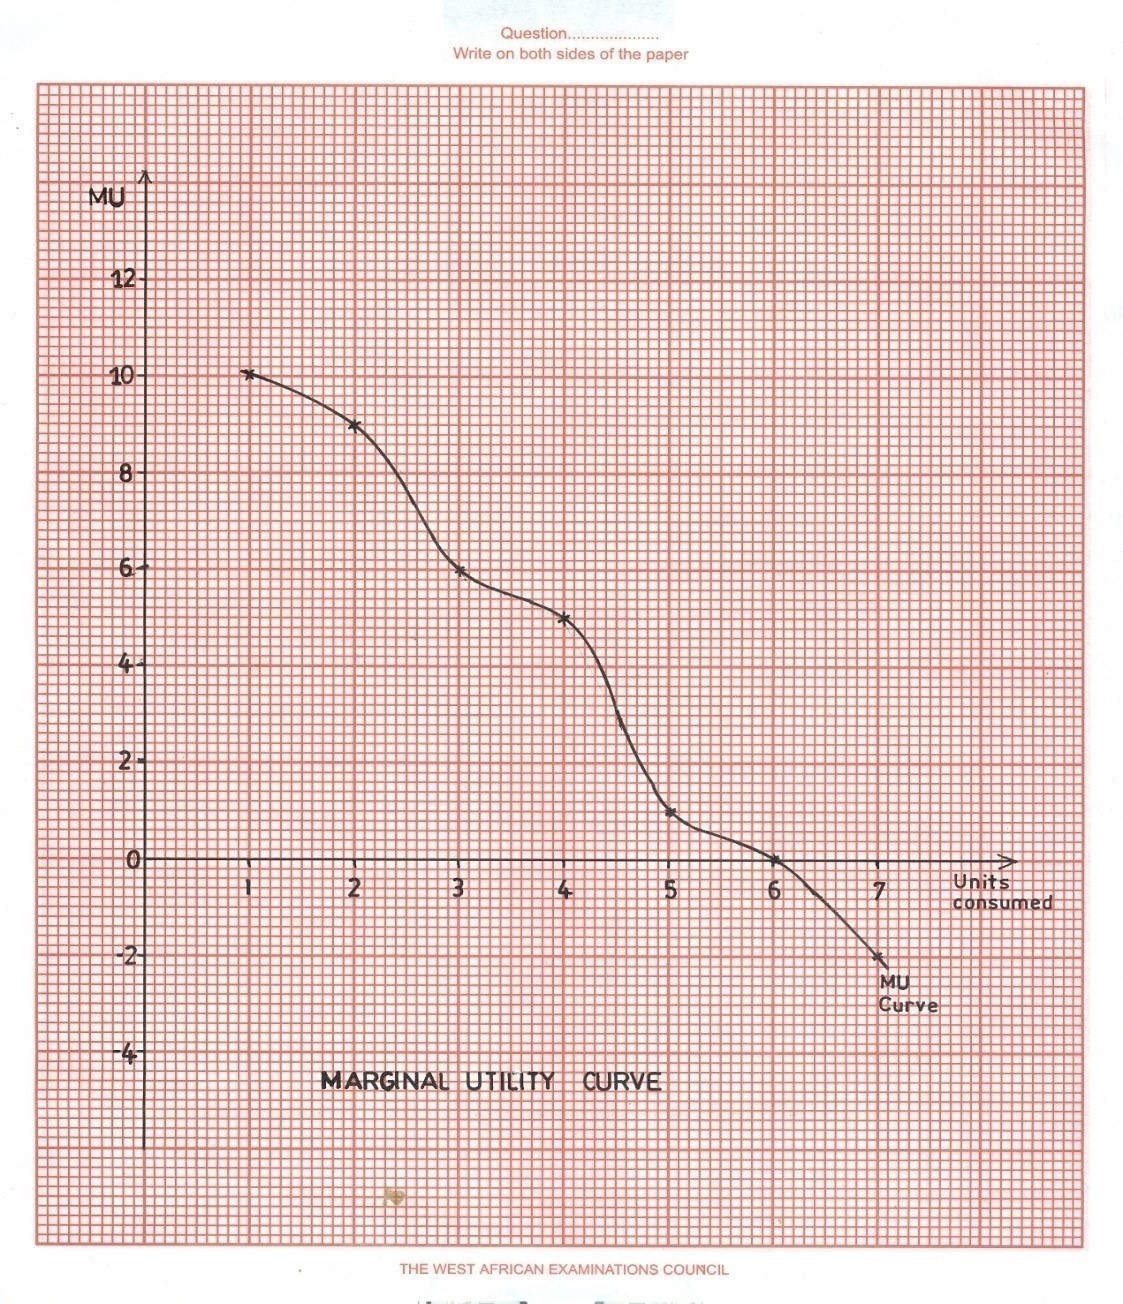
(d) The law of diminishing marginal utility states that as a consumer consumes more units of a commodity, the satisfaction derived from each additional unit of the commodity diminishes.