
Question 3
- What is a production possibility curve?
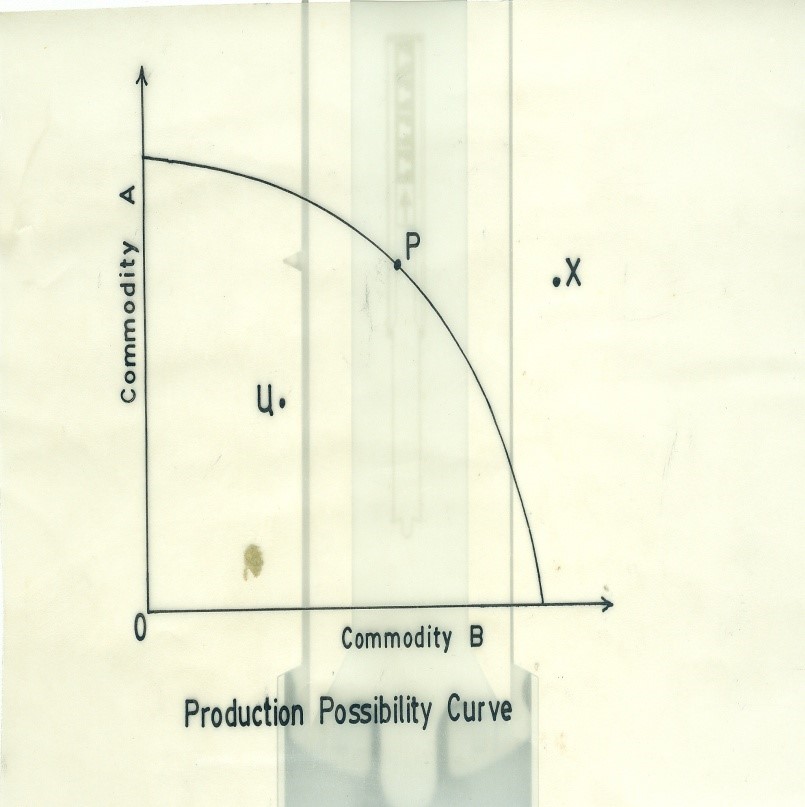
- Draw a production possibility curve and indicate any:
point P, where resources are fully utilized;
point U, where resources are under-utilized;
point X, where production is not feasible. - Explain any two factors that can make production at point X feasible.
- Why is the production possibility curve negatively sloped?
A good number of candidates attempted this question and scored relatively high marks. The question required candidates to define production possibility curve, draw a production possibility curve and explain why the PPC is negatively sloped. Most candidates could define and draw the PPC, but could not adequately explain factors that could make production feasible at point X on the diagram. Candidates were expected to answer thus to obtain maximum marks:
(a) Production possibility curve may be defined as a diagram or graph showing the possible combinations of two commodities that can be produced given a particular amount of resources and level of technology in an economy, within a given period of time.
(b)
(c)
(i) An increase in the supply of productive resources e.g. factor inputs, money, time etc
(ii) Technical progress: improvement in technology through research and development.
(iii) When productive resources are reallocated to the production of capital goods as against consumer goods.
(iv) Introduction of new ideas or methods.
(v) Human capital development through training and retraining.
(d) The production possibility curve has negative slope because it illustrates that there is opportunity cost involved in the production of more of one of the commodities.