
Question 12
The table shows the marks obtained by students in an examination.
| Marks | 0-9 | 10-19 | 20-29 | 30-39 | 40 – 49 | 50 – 59 | 60 – 69 | 70– 79 | 80– 89 | 90– 99 |
|
Number
of Student |
5 | 5 | 10 | 18 | 23 | 23 | 9 | 4 | 2 | 1 |
- Construct a cumulative frequency table for the distribution.
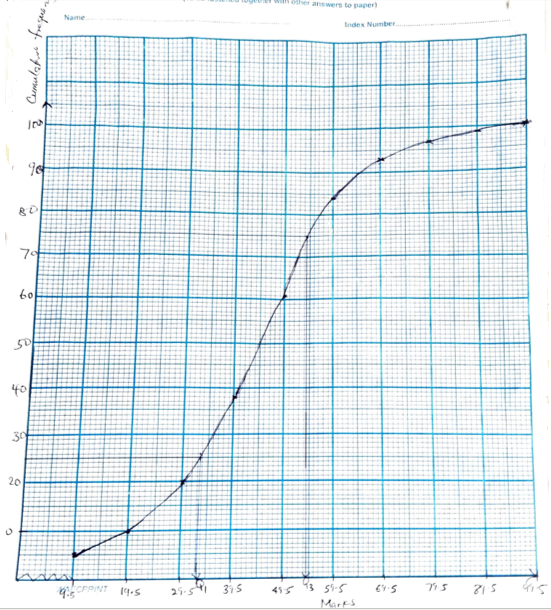
- Draw an ogive for the distribution.
-
-
Use the ogive in 12(b) to determine the:
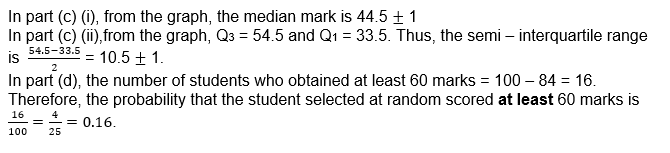
- median mark
- semi – interquartile range.
- If a student is selected at random, what is the probability that he obtained at least 60 marks?
Observation
The Chief Examiner observed that this question was popular among the candidates but not well attempted.
Majority of them were able to construct the cumulative frequency table for the distribution and drew the ogive.
However, many of the candidates did not use the upper class boundaries for their ogive.
In part (a), they obtained the cumulative frequency table as:
| Marks | UCB | f | cf |
| 0 – 9 | 9.5 | 5 | 5 |
| 10-19 | 19.5 | 5 | 10 |
| 20-29 | 29.5 | 10 | 20 |
| 30-39 | 39.5 | 18 | 38 |
| 40-49 | 49.5 | 23 | 61 |
| 50-59 | 59.5 | 23 | 81 |
| 60-69 | 69.5 | 9 | 93 |
| 70-79 | 79.5 | 4 | 97 |
| 80-89 | 89.5 | 2 | 99 |
| 90-99 | 99.5 | 1 | 100 |
|
|
 |