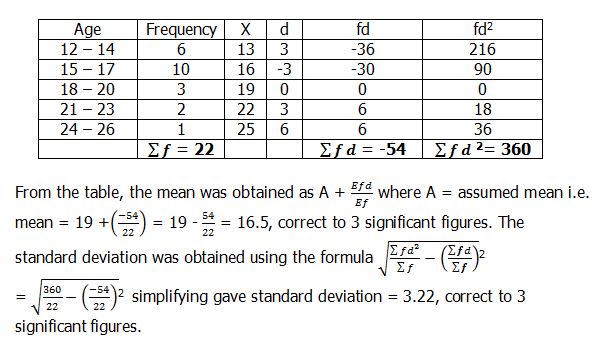
The table shows the distribution of ages of 22 students in a school.
Age (years) |
12 - 14 |
15 - 17 |
18 - 20 |
21 - 23 |
24 – 26 |
Frequency |
6 |
10 |
3 |
2 |
1 |
Using an assumed mean of 19, calculate, correct to three significant figures, the:
- mean age;
- standard deviation;
of the distribution.