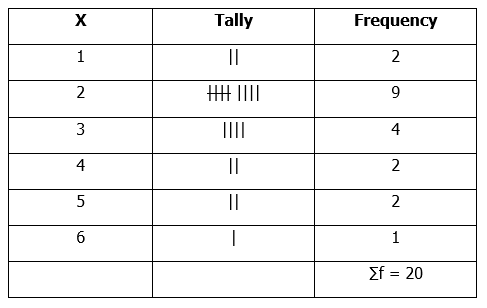
- Draw a frequency distribution table for the following scores: 3, 2, 4, 2, 3, 2, 1, 2, 2, 4, 5, 2, 5, 3, 1, 2, 2, 6, 2, 3.
- Use the frequency distribution table in 6(a) to find the mean deviation.
Observation
The Chief Examiner reported that this question was very popular among the candidates as majority of them attempted it and they performed well in it. However, it was also reported that some candidates stopped at calculating the mean and did not go further to calculate the mean deviation as required. A few others did not recognize that the table expected was for discrete data and not for grouped data. Also, errors during the computation were highlighted by the Chief Examiner.
In part (a), Candidates were expected to obtain the following table:
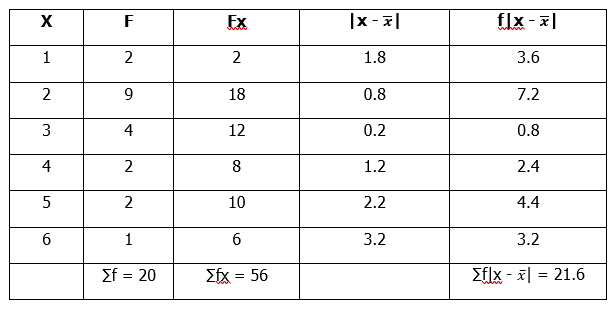
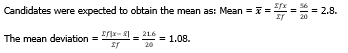
In part (b), Candidates were expected to obtain the following table: