Question 13
The table shows the frequency distribution of the ages of patients in a clinic:
Age (Years) |
17 – 19 |
20 – 22 |
23 – 28 |
29 – 34 |
35 – 43 |
No. of Patients |
6 |
9 |
12 |
18 |
18 |
- Draw a histogram for the distribution;
- Find, correct to two decimal places, the mean age of the patients.
Observation
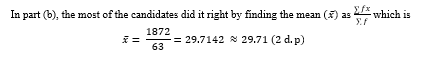
The Chief Examiner reported that majority of the candidates could not draw the required histogram due to unequal class interval and poor knowledge of frequency density. However, they were able to calculate the mean age of the patients in part (b).
In part (a), it was expected that the candidates present the frequency distribution table as shown:
Age |
Frq (f) |
Class Boundary |
Class Size (c) |
f/c |
X |
fx |
17 – 19 |
6 |
16.5 – 19.5 |
3 |
2 |
18.0 |
108 |
20 – 22 |
9 |
19.5 – 22.5 |
3 |
3 |
21.0 |
18.9 |
23 – 28 |
12 |
22.5 – 28.5 |
6 |
2 |
25.5 |
306 |
29 – 34 |
18 |
28.5 – 34.5 |
6 |
3 |
31.5 |
567 |
35 – 43 |
18 |
34.5 – 43.5 |
9 |
2 |
39.5 |
702 |
|
63 |
|
|
|
|
1872 |