Question 6
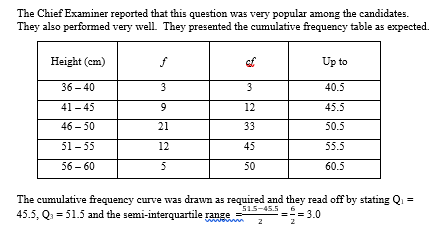
The table shows the heights in cm of some seedlings in a certain garden.
Height (cm) |
36 – 40 |
41 – 45 |
46 – 50 |
51 – 55 |
56 – 60 |
Frequency |
3 |
9 |
21 |
12 |
5 |
- Draw a cumulative frequency curve for the distribution.
- Using the curve in 6(a), find the semi-interquartile range.
.
Observation