Question 2
Table X shows the value of fish exported from country Q between the years 2005 and 2007. Use the table to answer the questions that follow.
FISH TYPE |
YEAR 2005 |
YEAR 2006 |
YEAR 2007 |
TOTAL |
Herring |
100 |
100 |
150 |
350 |
Bonga |
30 |
70 |
150 |
250 |
Snapper |
70 |
140 |
100 |
310 |
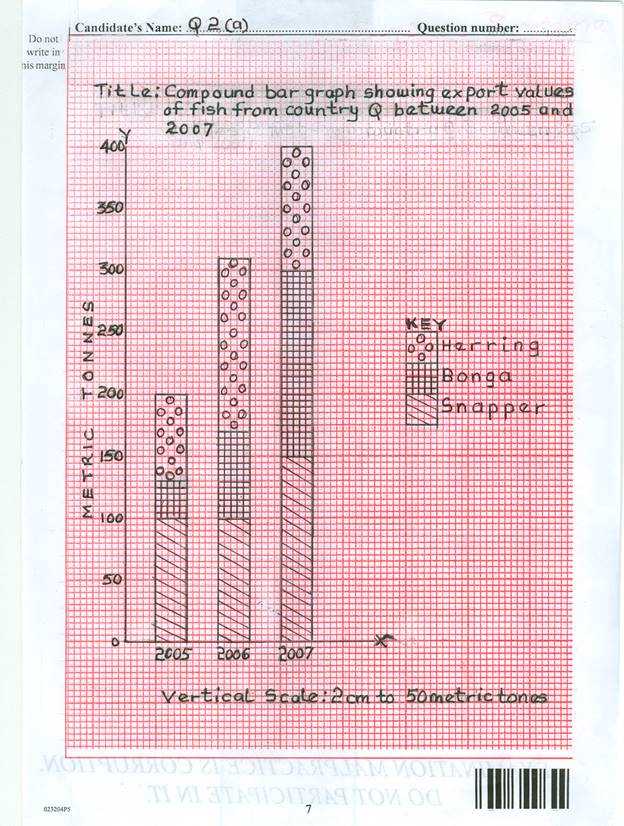
- Represent the data in Table X on a compound bar graph, using the years of export in the base of the graph (x-axis) and a scale of 2cm to 50 metric tonnes on the vertical axis (y-axis).
- State one advantage of the use of compound bar graphs.
- Name one other method that can be used to illustrate the data.
Observation
The question was not popular among the candidates and only few of the candidates who answered the question were able to plot the graph correctly. The advantage of compound bar graph could not be stated by some of the candidates. The advantages include:
- easy to construct.
- can take many distributions in one graph.
- gives quick visual impression.
- easy to interpret.
- comparing values is easy values using the scale
- mathematical calculation of values is easy.
- group bar graph or multiple bar graph
- compound line graph
- percentage bar graph.
- pie chart
- proportional circles
Other methods of illustrating the data include:
The graph is illustrated below.