Question 1
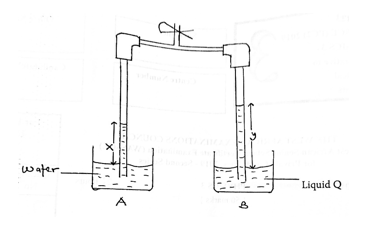
The diagram above illustrates two vertical tubes connected at the top by a pipe fitted with a clip. The lower ends of the tube are dipped into beakers A and B containing water and liquid Q respectively.
Air is sucked out of the tubes by opening the clip, causing the liquids to rise up the vertical tubes. The clip is then closed and the heights x and y of the water and liquid Q respectively, above the surface of the liquids in the beakers, are measured
The experiment is repeated five more times allowing the liquids to rise higher in the tubes in each case
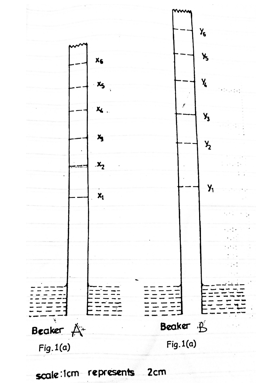
Fig. 1(a) and Fig. 1(b) illustrate the heights xi and yi respectively, where i = 1, 2, 3, 4, 5 and 6.
(i) Measure and record the raw x values and their corresponding y values.
(ii) Using the given scales, converts xi and yi to the real values Xi and Yi respectively
(iii) Tabulate the readings.
(iv) Plot a graph of Y on the vertical axis and X on the horizontal axis.
(v) Determine the slope s, of the graph.
(vi) Evaluate k = s-1
(vii) State two precautions you would take if you would take if you were to perform this experiment in the laboratory.
(b) (i) Explain the term pressure.
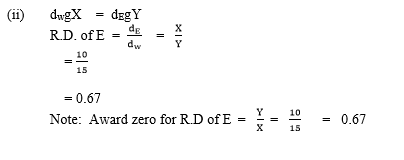
(ii) If liquid Q is replaced with liquid E in the above experiment, calculate the relative density of E when X = 10.0 cm and Y = 15.0 cm
Observation
Part (a) Candidates performance below average. However, many candidates did not start the graph of ml against T2 from the origin as was required by the question, hence, they could not determine the intercept on the ml axis.
Part (b) The question was fairly attempted. Some candidates could not explain why the amplitude of oscillation of a loaded test tube decreases with time.
The expected response is as stated below:
-Six values of x correctly measured and recorded to at
- (Award ½ mark each)
- Six values of y correctly measured and recorded to at
- least 1 d.p. and within tolerance of ± 0.1cm
- (Award ½ mark each)
- Six values of X correctly converted
- (Deduct ½ mark for each wrong or missing value)
- Six values of Y correctly converted
- (Deduct ½ mark for each wrong or missing value)
- Composite table showing at least x, y, X and Y.
- Evaluate k = s-1
- Plot a graph using reasonable scales
- draw line of best it
- determine the slope and intercept of the graph
- state any two of the following precautions.
e.g. - Avoid parallax error on metre rule
- Avoid splashing of water
- Ensure rigid/firm support
- Repeated readings stated In part b, the expected answers are:
(b) (i) Pressure is the force acting normally/perpendicularly per unit area.
Its unit is N m-2. OR it is not a vector quantity