This question was reported to be attempted by majority of the candidates and they performed very well in it. Majority of the candidates displayed good understanding of probability.
In part (a), majority of the candidates were reported to have recalled that the probability of all three passing = (probability that Manful and John and Ernest will pass) =  =
=  . However, it was also observed that some candidates added instead of multiplying the probabilities. This was wrong.
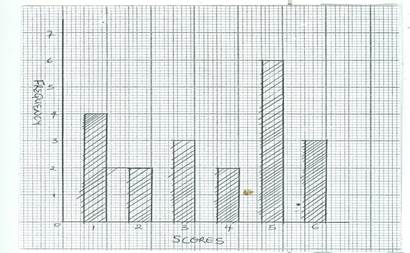
In part (b), while majority of them were able to construct the frequency distribution, they were reported not to calculate the interquartile range correctly. Others drew histograms instead of bar charts. They were expected to obtain the following table:
Scores (x) |
Tally |
Frequency (f) |
1 |
êêêê |
4 |
2 |
êê |
2 |
3 |
êêê |
3 |
4 |
êê |
2 |
5 |
êêêêê |
6 |
6 |
êêê |
3 |
|
|
Σf = 20 |
Using graph sheets, they were expected to draw the bar chart as follows:

The first quartile was the ( 20)th score. i.e. the 5th score which was 2. The third quartile score was the (
 20)th score i.e. the 15th score which was 5.Therefore, the interquartile range was 5 – 2 = 3.


