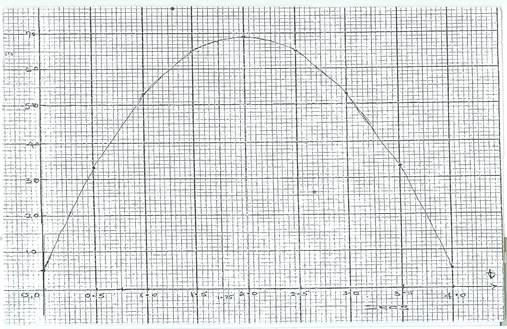
The Chief Examiner reported that this question was popular among the candidates and they performed very well in it. Majority of them were reported to have completed the table of values and plotted the points correctly. However, some of them did not apply the correct scale and some others could not read from the graph correctly. Candidates were expected to substitute each value of t into the equation to obtain the corresponding values for y and tabulate these values to obtain
t |
0.0 |
0.5 |
1.0 |
1.5 |
2.0 |
2.5 |
3.0 |
3.5 |
4.0 |
y |
5 |
33 |
53 |
65 |
69 |
65 |
53 |
33 |
5 |
Using these values of t and the given scales, candidates were expected to draw the graph as shown

From the graph, the height reached when t = 1.75 was 68 (± 0.5) m, the times the object was at a height of 50 m was 0.9 and 3.1 seconds (± 0.5 second) and the maximum height reached was 69 m.


