Question 2
The table below shows the revenue generated by a country in 2005. Study it and answer the questions that follow:
S/N |
ITEM |
AMOUNT($) |
1. |
Rents, royalties and profits |
240,000,000 |
Table 2
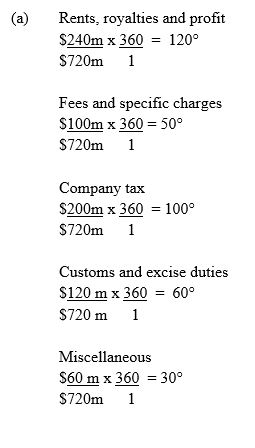
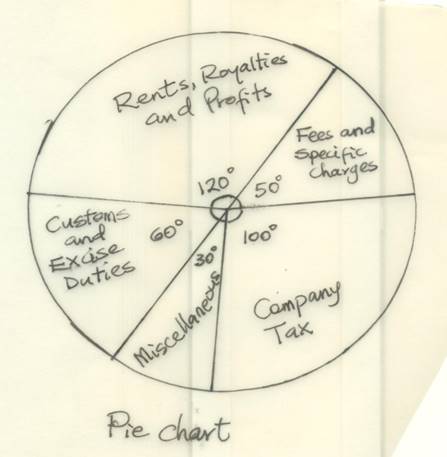
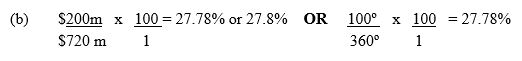
- Use the information in Table 2 to draw a pie chart (show calculations).
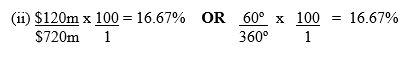
- What percentage of total revenue is company tax?
- Identify from the table:
- one direct tax;
- one indirect tax.
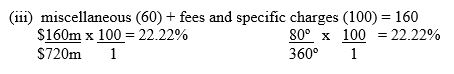
This is the alternative data response question to question (1) and was attempted by most of the candidates, majority of whom scored very high marks. The question required candidates to draw a pie chart showing their calculations, determine the percentage of company tax that makes up total revenue and to identify one direct and one indirect tax from the table in the (a), (b) and (c) parts of the question respectively. Most of the candidates were able to draw the pie chart, showing their workings, determine percentage of company tax that makes up the total revenue but few candidates had problems identifying items that are direct and indirect taxes. This made few of them to lose some marks.
The candidates were expected to provide the following answers to obtain the maximum marks.
(c)
- Direct tax – company tax
- Indirect tax – customs and excise duties.
For visually impaired candidates only
(a)(i) Calculation in degrees(°) as above.