
Question 2
The Table Z below shows the production of groundnut (in thousand tonnes) of regions A, B and C of country X during the years of 2009 and 2010. Use the data in the table to answer the questions that follow.
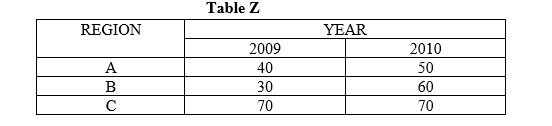
(a) Represent the data in Table Z on a multiple bar graph, using the years of production as the base of the graph (X-axis) and a scale of 2cm to 10,000 tonnes on the vertical axis (Y-axis)
(b) State:
(i) three advantages of multiple bar graph;
(ii) two disadvantages of multiple bar graph.
Observation
This question was attempted by most candidates, majority of whom could not the scale given to them. Few of them were however able to state the advantages and disadvantages of bar graph. Candidates were to include the following in their answers:
(b) (i) Advantages of multiple bar graph
- easy to draw
- easy to interpret
- depicts relationships between two or more variables
- involves only simple calculations
- several bars can be produced on a single graph
- summarizes large amount of data in one graph
- provides good visual impression
- provides a quicker understanding of the pattern of distribution
- easy to compare variables
- allows variation in either presenting of the bars vertically or horizontally
- exact values in the distribution can be worked out from the graph
Any three points at 1 mark each = 3 marks
(ii) Disadvantages of multiple bar graph
- could pose a challenge to people with poor spatial perceptual ability
- does not show grand total of values in distribution
- can be confusing when bars are numerous
- not good for use when extreme values are involved
- reduction of values to scale could be tasking
- choice of scale when not given could be difficult
- when guidelines are not given, different graphs are produced
- leads to graphs of different height if different scales are used
- takes only few categories of variables in one graph