
QUESTION 5
The table shows the distribution of marks of students in a test.
Marks |
40 |
41 |
42 |
43 |
44 |
45 |
46 |
Frequency |
7 |
4 |
6 |
2 |
4 |
2 |
6 |
- Represent this information on a bar chart.
- Find the median mark.
- Calculate, correct to three decimal places, the probability that a student selected at random scored less than the median mark.
Observation
The report showed that Candidates’ could not differentiate between bar chart and histogram. They however, were able to calculate the probability. The performance was averagely okay.
The Candidates’ ought to have drawn the Bar chart as follows:
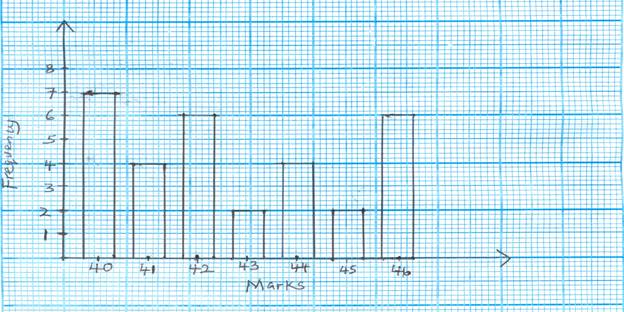
Thereafter, the Median Marks as 42 and the number of students that scored less than 42 = 7 + 4 =11
![]() = 0.355 (correct to three decimal figures).
= 0.355 (correct to three decimal figures).