
Question 1
AIM: To investigate a resistive-capacitive timing circuit.
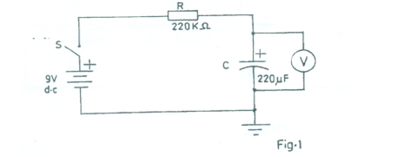
- Connect the circuit as shown in Fig. 1.
- Ask the supervisor to check the circuit connection.
- Set the power supply to 9 V d.c.
- Measure and record the power supply voltage Vs
- Close switch S and start the stopwatch simultaneously.
- Open switch S and reset the stopwatch.
- Plot a graph of voltage (V) on the vertical axis against time (s) on the horizontal axis.
- Comment on the graph.
-
Calculate:
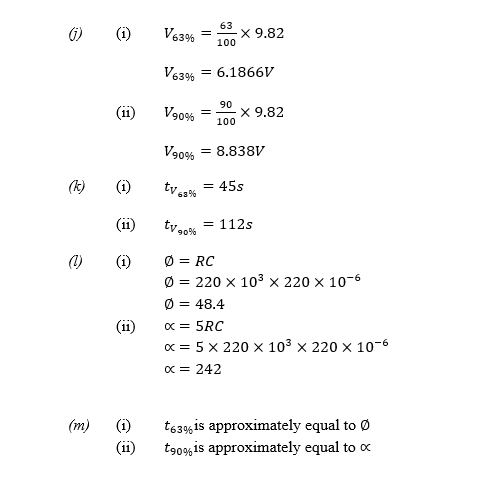
- 63% of the supply voltage, Vs recorded in (d);
- 90% of the supply voltage, Vs recorded in (d).
- From the graph, determine the time at which the voltage is equal to:
- Vs(63%);
- Vs(90%).
-
Calculate:
- ∅=RC;
- α=5RC.
- Compare and comment on your answers in:
- (k)(i) and (l)(i) i.e. t63% and ∅;
- (k)(ii) and (l)(ii) i.e. t90% and α.
- State two applications of the circuit in Fig.1 in a television receiver.
- State two precautions taken to ensure the accuracy of your readings.
Time (s) |
20 |
40 |
60 |
100 |
140 |
180 |
220 |
Voltage (V) |
|
|
|
|
|
|
|
Observation
Candidates were expected to construct a timing circuit and take readings accordingly. The Chief Examiner reported that despite having 9 V in the circuit diagram to depict the power supply voltage, Vs, a few candidates gave outrageous values. In computing the value of ∅, a few candidates ignored the prefix ‘kilo’ in 220kΩ and the ‘micro’ in 220μF thereby loosing marks for sub-question (l). It was also stated that many candidates refused to let the spotted points on the graph dictate the line of best fit as some tried to force it to be a straight line.
The expected responses were:
(d) VS = 9.82 V (Accept values between 8.50 - 10.00V )
Table 1
Time (s) |
20 |
40 |
60 |
100 |
140 |
180 |
220 |
Voltage (V) |
3.84 |
4.94 |
5.41 |
5.91 |
6.16 |
6.32 |
6.42 |
Values of voltage (V) between 3.00 V and 10.00 V (in ascending order)
(h) A non-linear graph with appropriate:
- title;
- choice of scales;
- plotting of points;
- joining of points;
- labelling of axes.
(n) Applications of the circuit in Fig. 1 in a television receiver
- Scanning circuit
- Automatic gain control (AGC)
- Auto level control (ALC)
(o) Precautions taken to ensure the accuracy of readings
- Ensure the capacitor is discharged before the switch is closed
- Avoid delay in timing and taking reading
- Ensure tight connections in circuit
- Avoided dry joint
- Avoid body resistance when taking readings