
Question 3
AIM: To determine the forward characteristics of a diode.
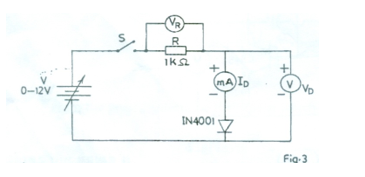
(a) Connect the circuit as shown in Fig. 3.
(b) Ask the supervisor to check the circuit connection.
(c) Adjust the power supply to 2.0V.
(d) Close switch S.
(e) Read and record in Table 3 the ammeter reading, ID, and voltmeter readings VD and VR.
Table 3
Vs (V) |
VD(V) |
I(mA) |
VR (V) |
V = VD + VR |
2.0 |
|
|
|
|
4.0 |
|
|
|
|
6.0 |
|
|
|
|
8.0 |
|
|
|
|
10.0 |
|
|
|
|
(f) Open switch S
(g) Repeat (c) to (f) for the other values of VS in Table 3.
(h) Complete Table 3 by calculating the values of VT.
(i) Plot a graph of ID on the vertical axis against VD (V) on the horizontal axis
(j) Calculate the slope of the graph.
(k) State the significance of the slope.
(l) From your results in Table 3, compare and comment on the values of VS and VT.
(m) State two precautions taken in carrying out the experiment.
Observation
In question 3, candidates were expected to conduct and experiment and take readings on the I-V characteristics of a diode in forward bias mode. The Chief Examiner reported that some candidates did not understand the theory of the non-linearity of the graph which implies that no conduction will take place until the potential barrier of the diode is overcome. A few candidates attempted to join the points at the extremes thereby loosing considerable marks.
Table 3
VS (V) |
VD (V) |
ID (mA) |
VR (V) |
VT = VD+VR |
2.0 |
0.65 |
0.0 |
1.35 |
2.0 |
4.0 |
0.70 |
3.0 |
3.30 |
4.0 |
6.0 |
0.74 |
5.0 |
5.26 |
6.0 |
8.0 |
0.82 |
7.5 |
7.18 |
8.0 |
10.0 |
0.91 |
10.0 |
9.09 |
10.0 |
VD (V) – values of ± 0.5 with respect to VD (V) in Table 3
ID (mA) - values of ± 1.0 with respect to ID (mA) in Table 3
VR (V) –values of ± 0.5 with respect to VR (V) in Table 3
VT (V) –values of ± 1.0 with respect to VT (V) in Table 3
(i) A non-linear graph with appropriate:
- title;
- choice of scales;
- plotting of points;
- joining of points;
- labelling of axes.
(j)
(values between 0.01 to 0.05A/V)
(k) Significance of the slope
- The conductance of the diode is 0.03A/V
- Inverse of the diode resistance is 0.03A/V
(l) Comparison between VS and VT
The values of Vs are approximately equal to the values of VT.
(m) Precautions taken in carrying out the experiment
- Ensure tight connections in the circuit
- Avoid parallax error in meter reading
- Ensure correct polarity of diode
- Avoid body resistance when taking readings
- Avoid dry joints.